


1. Introduction
Since the 2000s, Korea’s abalone aquaculture industry has rapidly expanded (Ock, 2015). Prior to the 1990s, abalone production was predominantly small-scale and heavily reliant on wild stocks harvested from natural habitats. The development of aquaculture technologies, along with the expansion of offshore cage farming facilities in the 2000s, enabled large-scale farmed abalone production feasible (Oh, Lee, and Kim, 2020). In Korea, farmed abalone production increased more than fiftyfold, rising sharply from 20 metric tons in 2000 to 1,065 metric tons in 2003 (Statistics Korea, 2025). During the same period, the share of marine aquaculture in total abalone production increased from 20.8% to 93.6%. By 2023, this share had reached 99.7%, indicating a near-complete transition to an aquaculture-dominated production structure.1 The mechanization of feeding systems has further enhanced production efficiency and contributed to the sustained growth of farmed abalone output (Lee and Park, 2010). As a result, Korea is now recognized as one of the world’s leading abalone producers, second only to China (Cook, 2016).
In recent years, growth in domestic consumption and international demand has failed to keep pace with the continued increase in production, resulting in persistent market oversupply and a decline in producer prices (Han et al., 2020). The producer price of abalone, standardized at 10 pieces per kilogram, declined from Korean Won (KRW) 48,780 in 2012 to KRW 23,222 in 2024, corresponding an average annual decrease of approximately 4%. While the shipment volume in 2024 reached 23,347 metric tons, marking a 1.2% increase compared to 23,061 metric tons in 2021, the total production value declined by approximately 30%, from KRW 694 billion to KRW 486 billion over the same period (Statistics Korea, 2025). This indicates a substantial decrease in total income for abalone producers due to falling prices, signaling deteriorating profitability and growing management uncertainty amid ongoing overproduction.
The rapid expansion of Korea’s abalone industry has brought forth several challenges that threaten its long-term sustainability, including disease outbreaks associated with high stocking densities and increased mortality rates driven by rising sea temperatures (Kim, 2020). In response to these heightened mortality risks, abalone farmers have shortened the grow-out period, which previously averaged 36 months (Nam and Sim, 2014). More recently, an increasing number of farms have further reduced the grow-out period to approximately 18 months prior to harvest (Seong, 2021). Although this strategy aims to mitigate mortality risks, it has also led to accelerated shipments, exacerbating market oversupply and placing additional downward pressure on prices.
The abalone industry is vulnerable to biological constraints and environmental fluctuations on the supply side (Morash and Alter, 2016). In addition, institutional inefficiencies in the distribution system reinforce market imbalances and increase price instability. Abalone is frequently distributed through informal channels, characterized by a high proportion of non-systematic sales and side payments, and transactions conducted via unofficial wholesale markets.2 These practices undermine price transparency in distribution processes at the production level (Cho and Lee, 2024). Accordingly, there is an increasing need to develop a supply and demand model that systematically captures the unique structural and behavioral characteristics of the abalone industry to improve forecasting accuracy and support evidence-based policy responses to market volatility.
Reliable information on the supply and price outlook for abalone is essential not only for producers and industry stakeholders but also for government policymakers (Choi and Cho, 2018). In response to the growing demand for economically and statistically robust forecasting models, Kim et al. (2014) developed the first supply-demand forecasting model specifically for the abalone industry. This model employed a partial equilibrium framework and was specified as a Recursive Model (RM), in which market equilibrium prices were determined sequentially based on projected domestic consumption. While the model enabled quarterly mid- to long-term supply forecasts, it exhibited limited model fit and low forecasting reliability. Specifically, it did not adequately capture the time lags and interdependencies among key structural components of abalone supply—namely, juvenile abalone input volume, grow-out stock, and shipment volume—which critically influence expected prices.
Cho, Choi, and Kim (2016) improved upon the previous model by incorporating the biological growth stages of farmed abalone and its supply structure, modifying the model to capture the dynamic monthly relationships among production, shipment, and pricing. To improve short-term forecasting accuracy, the original quarterly model was revised to operate on a monthly basis. Furthermore, since juvenile abalone input and grow-out volumes are measured in numbers of individuals while shipment volumes are reported in metric tons, a conversion formula was applied to standardize the units of measurement. These enhancements improved the model’s performance in forecasting short-term shipment volumes and wholesale market prices. Nevertheless, certain explanatory variables included in the model lacked strong theoretical justification, indicating limitations in the model’s overall validity.
Han and Jang (2019) identified potential uncertainties and inaccuracies in the quantity-to-weight conversion formulas used in earlier models to standardize juvenile abalone input, grow-out volume, and shipment volume. To address these issues, they developed a model that retains the original measurement units. Shipment data were converted into age-based estimates, and behavioral equations were specified within a dynamic ecological framework reflecting the biological growth cycle and harvest timing of abalone. The observed short-term fluctuations in the abalone market, driven predominantly by supply-side variations rather than demand, imply that a Simultaneous Model (SM) is theoretically preferable. However, due to limited availability of monthly data, the model was structured as a RM. Although the conversion from size-based to age-based figures may have introduced measurement errors—constituting a limitation—the model’s significance lies in its ability to reduce supply-side modeling errors.
The purpose of this study is to develop a SM that quantitatively captures the characteristics and dynamic behavior of Korea’s abalone market. The proposed model incorporates biological production cycles, endogenous interactions between supply and demand, and structural shifts identified in time-series data. To improve the predictive accuracy and policy relevance beyond existing models, key behavioral equations are re-estimated and refined. Forecast performance is assessed using both in-sample and out-of-sample error metrics. The proposed SM is intended to serve as a practical tool for supply-demand forecasting and policy formulation within the abalone industry.
This study offers several distinctive contributions. First, the model derives the equilibrium price under the market equilibrium condition in which total supply equals total demand. Second, the grow-out stock is classified into two categories based on recent age distribution patterns. Third, juvenile abalone input from November to April is estimated in aggregate, applying recent monthly proportions to capture seasonal patterns. Fourth, export volume equations are disaggregated into exports to Japan and other countries excluding China, and export unit price equations are newly introduced.
2. Overview of the Korean Abalone Aquaculture Industry
Juvenile seeding represents the initial stage of abalone aquaculture. Since 2021, the previously rising trend in juvenile input volumes has reversed, shifting toward a declining pattern. Wando county serves as the leading production area for farmed abalone in Korea (Ock, 2015). Between 2008 and 2023, it accounted for approximately 77% of the nation’s total juvenile seeding. The seeding period can be broadly categorized by hatching time: early-hatched juveniles are typically seeded from October to November, whereas late-hatched juveniles are seeded from March to April of the following year. Although early-hatched juveniles generally command higher prices, they exhibit superior growth performance, enabling a shorter grow-out period and greater economic efficiency (National Fisheries Research and Development Institute, 2008).
Juvenile seeding historically took place from October through the following May. However, since 2011, seeding in October has been discontinued, and from 2021 onward, the overall seeding window has gradually narrowed to the period between November and April. In Wando, the main production region, seeding has been predominantly concentrated between November and the following January. Regional variation was evident in 2006; over time, the Jindo, Shinan, and Haenam regions have increasingly aligned with the Wando pattern, with the proportion of seeding occurring between November and January increasing significantly—from approximately 37% in 2011 to 86% by 2023. Monthly and regional seeding trends are summarized in Table 1.
After reaching a certain size, juvenile abalone are typically transferred to offshore cage systems for grow-out, where the cultivation period varies according to biological growth rates (Choi and Cho, 2018). Grow-out stocks are generally classified into four age groups: under one year, one year, two years, and three years or older. Abalone aged one year or older are considered marketable and are shipped accordingly. As shown in Figure 1, while total grow-out volume has been increasing since 2008, growth has stagnated since 2017, suggesting a saturation of farm capacity and a strategic shift in production planning.
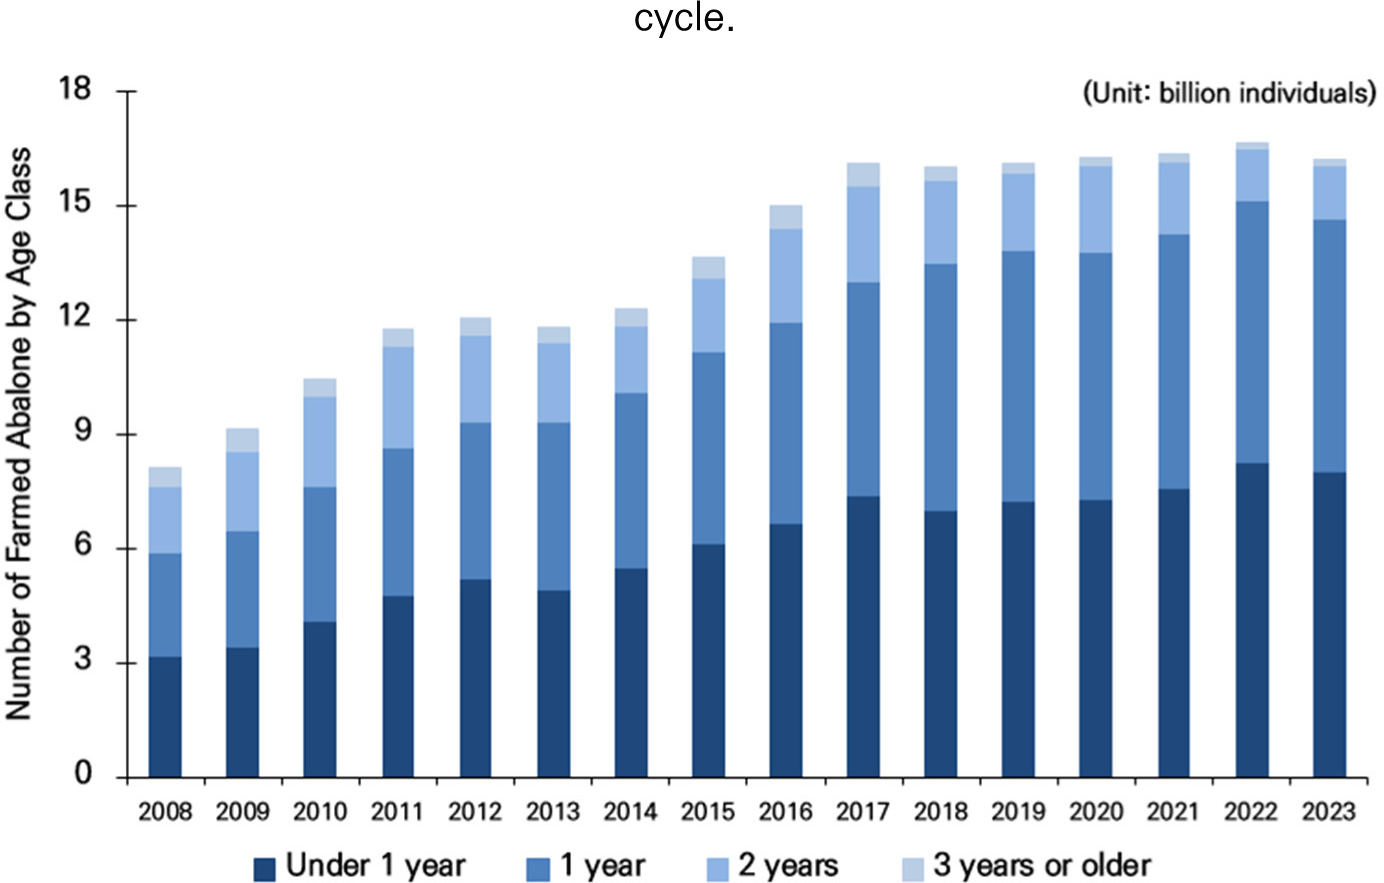
More notably, the age distribution of grow-out stock has shifted significantly. The shares of abalone under one year and one year old rose from 39.2% and 33.1% in 2008 to 49.5% and 41.0% in 2023, respectively. Conversely, the shares of two-year-old and three-years-and-older abalone declined from 21.8% and 5.9% to just 8.5% and 0.9%. Such compositional changes indicate a clear industry-wide transition toward shorter production cycles, which reflects a broader strategy to mitigate high mortality risks (Nam and Sim, 2014).
Abalone are shipped according to size classifications: 8 pieces per kilogram, 9–11 pieces, 12–15 pieces, 16–20 pieces, and more than 21 pieces. In recent years, there has been a marked increase in the shipment of smaller-sized abalone (Kim, 2020). Historically, consumer preferences leaned toward larger abalone, owing to their perceived nutritional benefits and higher market value, which encouraged producers to prioritize the cultivation of larger individuals (Ock, 2013). However, a recent shift in consumer demand toward smaller, more affordable abalone has resulted in increased shipment and production of smaller size categories (Choi, 2017).
Abalone survival and growth rates are influenced by environmental conditions (Kim, 2020). In particular, feeding activity decreases when the water temperature falls below 7°C, while mass mortality can occur if the temperature rises above 28°C due to feed spoilage (National Institute of Fisheries Science, 2008). To improve survival rates, abalone farms have shorten the cultivation period so that abalone experience the high-temperature summer season only once (Seong, 2021) (Table 2).
Most abalone imported into Korea is frozen or processed, differing in usage from domestically produced live abalone (Shin, Jang, and Kim, 2008). Korean abalone exports are primarily directed to Japan, and shipments to Vietnam, Taiwan, and the United States have also increased in recent years. Exports to Japan have grown by an average of 16% annually since 2008, reaching 2,223 metric tons in 2023. Exports to Vietnam, Taiwan, and the United States rose from just 3 metric tons in 2009 to 403 metric tons in 2023, reflecting notable market expansion. China, in particular, experienced a temporary spike in demand for Korean abalone due to its domestic supply and rising prices (Korea Maritime Institute, 2016). Consequently, Korea exported 589 metric tons to China in 2016 and 386 metric tons in 2018, but volumes remained minimal in other years.
3. Methodology
This study utilizes monthly data spanning from July 2008 to May 2024, which was provided by the Korea Maritime Institute (KMI) for analysis. Data prior to July 2008 were excluded from the analysis to enhance the explanatory power of the model. The model is constructed based on a Dynamic Ecological Equation Model (DEEM) framework, reflecting the biological characteristics of abalone, thus sharing a common foundation with prior studies (Cho, Choi, and Kim, 2016; Han et al., 2020). However, unlike previous research that primarily employed a RM, this study adopts a SM, in which supply and demand interact bidirectionally to determine equilibrium prices.3
The abalone supply and demand model comprises three components: supply, demand, and price. The model’s structural framework is presented in Figure 2. The supply component is defined as the total volume of domestic abalone shipments. The demand component consists of the sum of domestic consumption and foreign demand. In Korea, most abalone imports are in frozen or processed form, which differ significantly in terms of consumption purpose from domestically produced live abalone (Shin et al., 2008). Therefore, imports are not considered to have a meaningful impact on the equilibrium price and are excluded from the supply side of the model. Regarding exports, Japan remains the primary destination for Korean abalone, but the share of exports to other countries such as Vietnam, Taiwan, and the United States has recently increased. In contrast, exports to China tend to be irregular due to fluctuations in its domestic supply and demand conditions. Accordingly, this study categorizes abalone exports into two segments: Japan and other countries (excluding China), and formulates separate behavioral equations for each.4
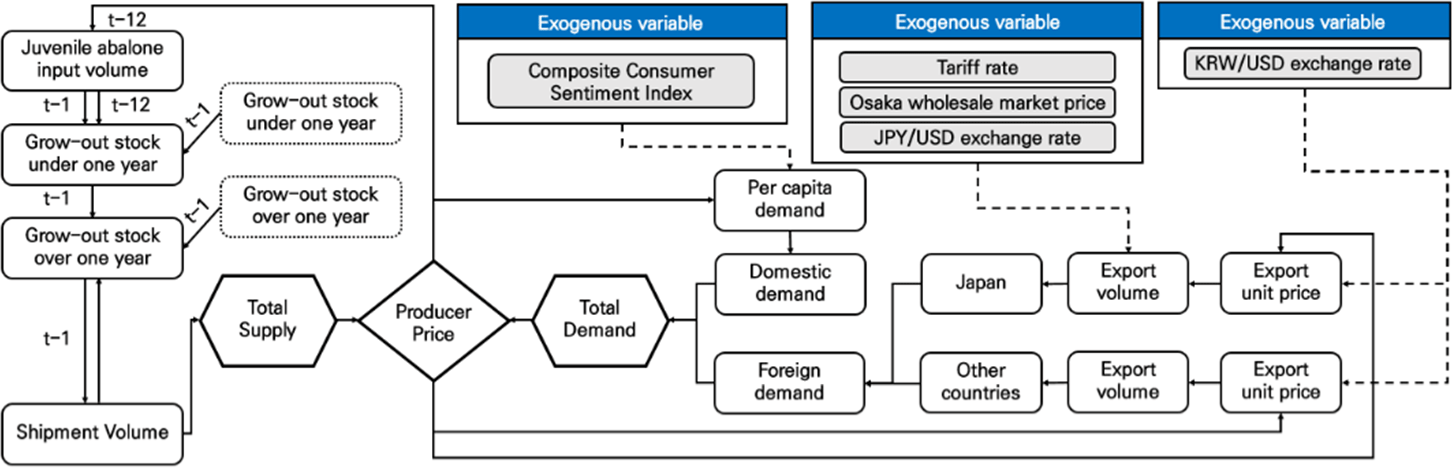
In Korea’s abalone distribution system, official auction prices are not established in wholesale markets (Lee, Choi, and Kang, 2016). Therefore, it is not appropriate to define the market equilibrium price based on wholesale prices. In practice, most abalone is traded directly at the production sites or through intermediaries, making the production stage the primary point of supply-demand equilibrium. Consequently, the producer price is regarded as the market equilibrium price. In this study, the representative producer price, defined as the price for a standard size of 10 pieces per kilogram, is adopted as the market equilibrium price for the purposes of analysis.5
Abalone shipment volume is determined by the production intentions of abalone farms. The volume of juvenile abalone input is used as a proxy variable to reflect these intentions. Juvenile seeding marks the initial stage of abalone aquaculture and serves as a key determinant of future shipments. Abalone seed is typically stocked in February and cultivated for 8 to 9 months before being seeded, primarily in Wando, starting in November (Han et al., 2020). Given this biological time lag, juvenile abalone input volume is assumed to be influenced by the average producer price observed from the previous November to the following April.
Once juveniles reach a certain size, they are transferred to offshore cage farms, entering the main grow-out phase (Kim et al., 2016). Recently, in response to high mortality rates, there has been a growing trend toward shortening the grow-out period, leading to a decreasing proportion of abalone aged two years or older (Nam and Sim, 2014). Therefore, this study classifies grow-out stock into two groups: under one year and one year or older.
The monthly volume of abalone under one year of age is influenced by the previous month’s juvenile abalone input, the previous month’s volume of abalone under one year of age, and the juvenile input from the same month in the previous year. In contrast, abalone aged one year or older are subject to market shipments and therefore require the inclusion of shipment-related factors. Specifically, the volume of abalone aged one year or older is affected by the portion of the previous month’s under-one-year abalone that has grown to one year or older, the previous month’s volume of abalone aged one year or older, and the shipment volume for the current month.
Total demand for abalone is composed of domestic consumption and foreign demand. In the domestic market, per capita abalone demand is assumed to be determined by the equilibrium price and the Composite Consumer Sentiment Index (CCSI).6 To control for price level fluctuations, the producer price is deflated using the Consumer Price Index (CPI). Theoretically, disposable income would be the most appropriate variable to reflect income effects; however, it is published on a quarterly basis, making it unsuitable for use in a monthly model. Therefore, this study employs the monthly CCSI as a proxy variable to capture consumers’ expectations and perceptions of economic conditions.
In modeling foreign demand, exports are classified into two categories: Japan and other countries (including Vietnam, Taiwan, and the United States). Export volume to Japan is specified using the demand function of Japanese importers. A 7% tariff is currently imposed on Korean abalone exports to Japan, and this cost is reflected in the export unit price. Abalone distributed in the Osaka wholesale market, produced domestically in Japan, may function as a substitute for Korean abalone. An increase in the Osaka market price can raise the demand for Korean abalone. The export unit price and the Osaka market price are used as explanatory variables for exports to Japan.
The exchange rate, defined as the Japanese Yen/United States Dollar (JPY/USD) exchange rate, is treated as an exogenous variable from the perspective of Japanese importers, as it determines the relative price of imports. A stronger yen (lower exchange rate) enhances the price competitiveness of Korean abalone in Japan, whereas a weaker yen (higher exchange rate) reduces it. The export unit price to Japan is modeled as a function of both the domestic equilibrium price and the exchange rate.
For exports to other countries, including Vietnam, Taiwan, and the United States, export volume is assumed to be determined solely by the export unit price. A tariff rate is not applied, as doing so would not accurately reflect the heterogeneous import conditions of these countries and may introduce bias in the estimation process. Due to data limitations regarding country-specific export prices, these destinations are grouped into a single category labeled “other countries,” for which a unified behavioral equation is specified (Table 3).
Note: 1) I denotes the seed stocking volume; FP10 refers to the producer price for 10-piece abalone; S0 indicates the grow-out stock under one year, while S123 refers to the grow-out stock over one year. Q represents the shipment volume. DEMAND denotes domestic demand; POP is the estimated population; CPI represents the consumer price index; CCSI refers to the composite consumer sentiment index. XJP denotes the export volume to Japan, and XPJP the corresponding export unit price. TARIFF indicates the applicable tariff rate, OMJP is the Osaka wholesale market price, and EXCHJPY/USD and EXCHKRW/USD represent the JPY/USD and KRW/USD exchange rates, respectively. XETC refers to the export volume to other countries (excluding China), and XPETC indicates the corresponding export unit price.
4. Analysis Result
This study adopts a SM that satisfies the market-clearing condition and endogenously determines the equilibrium price through simultaneously specified supply and demand equations. Although simultaneity bias—arising from the correlation between explanatory variables and the error term—remains a theoretical concern in such systems (Rhew, 2017), the structural form specified in this study does not exhibit endogeneity among the behavioral equations. Consequently, all equations are estimated using the ordinary least squares method.
The behavioral equations of the abalone supply and demand model were estimated using EViews 8. The Breusch–Godfrey Lagrange Multiplier (LM) test was applied to detect autocorrelation in the residuals, as the model includes lagged dependent variables among the explanatory variables (Godfrey, 1978). The presence of autocorrelation was also assessed using the Durbin–Watson statistic. In cases where autocorrelation was detected, the Newey–West estimator was used to obtain robust standard errors (Newey and West, 1994).
To account for potential structural changes in the time-series data, a multiple breakpoint test was conducted. While the traditional Chow test identifies a single breakpoint by comparing two predefined sub-periods (Chow, 1960), the Bai–Perron test enables the simultaneous detection of multiple structural breaks within the series (Bai and Perron, 1998). In this study, the Bai–Perron test was applied, with only those breakpoints deemed statistically significant at the 5% level or below retained to enhance the robustness and reliability of the analysis.7
The estimation results for juvenile abalone input volume are presented in Table 4. The average producer price of 10-piece abalone from November to the following April has a statistically significant effect on seed stocking volume at the 5% significance level. Given that seeding activities are concentrated during this period, the volume is influenced by the average abalone price observed over the same months in the previous year. The estimation results indicate that a 1% increase in the 10-piece abalone price leads to a 0.1% increase in seed stocking volume. This finding implies that abalone farmers respond to price signals when making production decisions, although the relatively low price elasticity observed may be attributed to biological or infrastructural constraints limiting short-term adjustments in seeding volumes.
2) As the number of observations used in the analysis is relatively small, the Newey-West estimator was applied to obtain robust standard errors.
3) FP10 refers to the average producer price from November of year t–1 to April of year t; TREND denotes a time trend variable; SD12 is a structural dummy for 2012 (0 for years prior to 2012, 1 for 2012 and onwards); and SD17 is a structural dummy for 2017 (0 for years prior to 2017, 1 for 2017 and onwards).
Although seed stocking volume had exhibited a steady upward trend, a decline was observed beginning in 2021. To capture this shift, both linear and quadratic time trend variables were incorporated into the equation. The estimation results suggest that seed stocking volume increased at an average annual rate of 17.2%, with the growth rate decelerating by 0.6%p per year. The abalone industry in Korea is characterized by a lack of standardized facility materials and construction practices, rendering it structurally vulnerable to natural disasters such as typhoons (Kim et al., 2013). In late August and mid-September of 2012, typhoons Bolaven, Tembin, and Sanba caused substantial damage to offshore abalone cages and hatcheries (Korea Maritime Institute, 2012). To reflect the structural impact of this event, a structural dummy variable was introduced for the post-2012 period. In addition, the year 2017 was identified as another structural breakpoint, associated with sluggish growth in seed abalone and an excessive accumulation of grow-out stock. The estimation results show that seed stocking volume declined by 23.2% following the 2012 typhoon events and by an additional 18.2% after 2017. These findings indicate that changes in the seed production and stocking environment have exerted a structural impact on the medium- to long-term dynamics of abalone supply.
The estimation results for the grow-out stock of abalone under one year of age are presented in Table 5. Reflecting the dynamic biological growth process of abalone, the monthly stock of individuals under one year is influenced by several key factors. These include the stock remaining from the previous month, which captures the natural survival and retention; the seed stocking volume in the previous month, representing the immediate inflow of new juveniles; and the stocking volume in the same month in the previous year, which accounts for biological growth transitions, specifically the maturation of abalone beyond the under-one-year classification.
2) B-G LM test refers to the Breusch-Godfrey test for autocorrelation, with p-values shown in parentheses.
The estimation results reveal that an increase of 10,000 individuals in the under-one-year stock from the previous month leads to an increases of approximately 9,845 individuals in the current month’s stock. Similarly, a 10,000-unit increase in the previous month’s seed stocking volume results in a 5,417-unit increase in the current stock under one year, indicating the transition of sufficiently grown seed abalone into the grow-out stage. Conversely, a 10,000-unit increase in the seed stocking volume from the same month in the previous year results in a 5,464-unit decrease in the current under-one-year stock, reflecting the biological progression of one-year-old abalone into the over-one-year category. These results confirm that short-term variations in juvenile input and carry-over stocks are key determinants of the monthly grow-out stock of abalone under one year of age.
In terms of seasonal stocking patterns, the proportion of seed abalone stocked in March averaged approximately 17% prior to 2018 but declined sharply to around 3% after 2019. This trend can be interpreted as a response to the increasing use of early-hatched juveniles, which, although more expensive, offer superior growth performance and reduce the overall grow-out period, thus enhancing economic efficiency (National Fisheries Research and Development Institute, 2008). To account for this structural change, a dummy variable was included for the month of March up to 2018. The estimation results indicate that the grow-out stock under one year in March before 2018 was higher by approximately 12,135 individuals compared to the same month after 2019.
The estimation results for the grow-out stock over one year are presented in Table 6. Abalone that are shipped to market have reached the grow-out stage of over one year (Han et al., 2020). Accordingly, the monthly stock of abalone over one year can be calculated by summing the previous month’s stock under one year and over one year, and then subtracting the current month’s shipment volume.
2) B-G LM test refers to the Breusch-Godfrey test for autocorrelation, with p-values shown in parentheses. The Newey-West estimator was applied to obtain robust standard errors.
3) S123 denotes the grow-out stock volume of abalone aged one year or older; S0 refers to the grow-out stock volume of abalone under one year of age; Q represents the shipment volume. SD16Y01M is a structural dummy variable that equals 1 from January 2016 onward (0 prior to January 2016), and SD22Y01M is a structural change variable that equals 1 from January 2022 onward (0 prior to January 2022).
The results show that a 10,000-unit increase in the grow-out stock over one year in the previous month leads to a 6,112-unit increase in the current stock. This suggests a relatively high mortality rate among older stock, potentially due to age-related vulnerability or environmental stressors. In addition, a 10,000-unit increase in the previous month’s stock under one year results in a 2,268-unit increase in the current stock over one year, which reflects the biological transition from under-one-year to over-one-year stock through natural growth.
Conversely, a one-metric ton increase in shipment volume leads to a 14,638-unit decrease in the over-one-year stock. Han et al. (2020) adjusted for the mismatch between shipment volume (recorded by size category) and grow-out stock (classified by age group) by applying region- and age-specific shipment proportions derived from size-based survey data. However, their estimates were based on outdated samples and did not fully account for recent changes in market structure and consumer preferences, potentially resulting in measurement errors. Therefore, the present study integrated total shipment volume without conversion to age-based units.
Based on average shipment ratios by size category during the analysis period (8-piece: 4.6%, 9–11-piece: 14.4%, 12–15-piece: 23.1%, 16–20-piece: 25.7%, over 21-piece: 32.1%) and average weight per size group, the number of abalone shipped per metric ton was estimated at approximately 16,435 individuals. Although the coefficient for shipment volume was not statistically significant, the estimated reduction of 14,638 individuals was similar to the computed conversion value, suggesting that the coefficient is economically reliable.
The stock of abalone over one year also exhibited a seasonal pattern, typically increasing sharply in November and gradually declining thereafter. To reflect this seasonality, seasonal dummy variables were included. In addition, changes in the data collection methodology for grow-out stock in November 2016 and 2022 were addressed by introducing structural dummy variables. As a result, the model estimates an increase of 30,070 individuals in November after 2016, and a decrease of 19,502 individuals in November after 2022.
The estimation results for shipment volume are presented in Table 7. A 1% increase in the grow-out stock over one year in the previous month leads to a 0.39% increase in the current month’s shipment volume. Additionally, shipment volume shows a monthly growth rate of 3%. Following the restoration and expansion of offshore cage facilities in typhoon-affected areas between 2012 and 2014, abalone that had been grown for 2–3 years began to be shipped in earnest starting in July 2016. The analysis estimates that from this point onward, the monthly shipment volume increased by an additional 3%p.
Abalone farmers tend to concentrate shipments during the summer months due to increased mortality risks associated with rising seawater temperatures. Furthermore, abalone is considered a high-demand gift product during the Chuseok holiday season, which further amplifies shipment activity in the preceding months (Korea Maritime Institute, 2017). As a result of these factors, abalone shipments exhibit a distinct seasonal pattern, particularly concentrated in the summer. To account for this, seasonal dummy variables were included in the model. The results show that, compared to December, shipment volume increases by 50% in July, 40% in August, and 44% in September.
The estimation results for per capita demand for abalone are presented in Table 8. Per capita demand is determined by the equilibrium price, the CCSI, and seasonal factors. The 10-piece producer price was converted to a real price using the CPI to eliminate the effects of inflation. The estimation indicates that a 1% increase in the real 10-piece producer price leads to a 0.4% decrease in per capita demand, yielding a price elasticity of –0.4. This suggests that abalone demand is price-inelastic, meaning demand does not significantly change in response to price fluctuations. In contrast, a 1% improvement in the CCSI leads to a 0.3% increase in per capita demand, implying an income elasticity of 0.3. This finding suggests that consumers tend to increase their abalone consumption when they perceive economic conditions more positively.
2) A Durbin-Watson value of 1.51 suggested autocorrelation, prompting the use of the Newey-West estimator.
3) FP10 denotes the farm-gate price for abalone based on 10 pieces; CPI represents the Consumer Price Index; CCSI stands for the Composite Consumer Sentiment Index; and TREND is the time trend variable. SD12Y06M is a structural dummy that equals 1 from June 2012 onward (0 prior to June 2012); SD16Y07M is a structural dummy for July 2016 onward; and SD22Y09M is a structural dummy for September 2022 onward.
Per capita demand had been increasing at a rate of approximately 1% per month; however, following a typhoon in June 2012 that reduced shipment volumes, the growth rate declined by 0.5 percentage points. After a temporary spike in exports to China in July 2016, the growth rate increased by 0.2%p, but it declined again by 0.2%p after September 2022, when exports expanded to countries such as Vietnam and Taiwan. As a result, the current monthly growth rate of per capita demand is approximately 0.5%. Similar to shipment patterns, abalone consumption is concentrated in the summer. This is mainly due to increased demand as a health food and a traditional Chuseok gift (Lee and Park, 2010). Per capita demand in July, August, and September is estimated to be 39%, 25%, and 30% higher, respectively, than in December.
The estimation results for export volume to Japan are presented in Table 9. The results indicate that a 1% increase in the export unit price leads to a 0.5% decrease in the volume of exports to Japan. Conversely, a 1% increase in the Osaka wholesale market price or a 1% depreciation of the Japanese yen against the U.S. dollar leads to a 0.4% increase in export volume to Japan. This implies that rising domestic abalone prices in Japan improve the relative competitiveness of Korean abalone in the Japanese market, subsequently stimulating demand through a substitution effect.
2) A Durbin-Watson value of 1.61 suggested autocorrelation, prompting the use of the Newey-West estimator.
3) XPJP denotes the export unit price to Japan; Tariff represents the tariff rate; OMJP refers to the wholesale market price in Osaka; EXCHJPY/USD is the yen-U.S. dollar exchange rate; and TREND indicates the time trend variable. SD14Y04M is a structural dummy that equals 1 from April 2014 onward (0 prior to April 2014), and SD20Y03M is a structural dummy that equals 1 from March 2020 onward (0 prior to March 2020).
Export volume to Japan exhibited a general upward trend during the analysis period, and a trend variable was included to capture this pattern. To examine potential structural changes over time, a multiple breakpoint test was conducted on the trend variable. The results indicate that, following the depreciation of the Japanese yen starting in April 2014, the monthly growth rate of exports to Japan weakened by 0.4%. Furthermore, after the outbreak of COVID-19 in March 2020, adverse export conditions led to an additional monthly decline of 0.1%p in the export growth rate.
The estimation results for the export unit price to Japan are presented in Table 10. The analysis shows that a 1% increase in the domestic 10-piece producer price of abalone leads to a 0.8% increase in the export unit price to Japan, suggesting that changes in domestic prices are proportionally reflected in export prices. Conversely, a 1% increase in the exchange rate (KRW/USD) results in a 0.7% decrease in the export unit price to Japan, indicating the impact of currency appreciation on price competitiveness.
2) A Durbin-Watson value of 0.53 suggested autocorrelation, prompting the use of the Newey-West estimator.
3) FP10 denotes the producer price for abalone based on 10 pieces; EXCHKRW/USD represents the Korean won-U.S. dollar exchange rate. SD09Y01M is a structural dummy that equals 1 from January 2009 onward (0 prior to January 2009); SD20Y09M is a structural dummy for September 2020 onward; and SD22Y11M is a structural dummy for November 2022 onward.
To detect structural changes, a multiple breakpoint test was conducted on the intercept term. The test identified significant structural breaks in January 2009, September 2020, and November 2022. Specifically, following January 2009, the export unit price declined by 14.1%. Due to reduced export demand stemming from the COVID-19 pandemic, an additional decline of 17.4% was observed after September 2020. In contrast, beginning in November 2022, the export unit price rose by 11%, which is presumed to reflect adjustments associated with a drop in the domestic producer price.
The estimation results for export volume to other countries (excluding China) are presented in Table 11. A 1% increase in the export unit price to these countries is estimated to reduce export volume by 1.25%, indicating a price elasticity greater than one and suggesting that export volume is highly sensitive to changes in export unit price. The export volume to other countries has shown a monthly growth rate of approximately 2.4%.
2) A Durbin-Watson value of 0.97 suggested autocorrelation, prompting the use of the Newey-West estimator.
3) XPETC denotes the export unit price to countries other than China; TREND represents the time trend variable. SD16Y06M is a structural dummy that equals 1 from June 2016 onward (0 prior to June 2016); SD17Y01M is a structural dummy for January 2017 onward; and SD22Y08M is a structural dummy for August 2022 onward.
To detect potential structural shifts over time, a multiple breakpoint test was conducted, identifying structural changes in June 2016, January 2017, and August 2022. Following June 2016, when exports to countries such as Vietnam, Taiwan, and the United States surged, export volume to other countries increased by an additional 2.4 percentage points. However, the growth rate weakened after the breakpoints in January 2017 and August 2022. As a result, the export volume returned to a stabilized monthly growth rate of approximately 2.8%.
The estimation results for the export unit price to other countries (excluding China) are presented in Table 12. A 1% increase in the domestic 10-piece producer price of abalone is associated with a 0.17% increase in the export unit price to these countries. In contrast, a 1% increase in the exchange rate (KRW/USD) is estimated to decrease the export unit price by 0.58%.
2) A Durbin-Watson value of 1.52 suggested autocorrelation, prompting the use of the Newey-West estimator.
3) FP10 denotes the producer price for abalone based on 10 pieces; EXCHKRW/USD represents the Korean won-U.S. dollar exchange rate. SD06Y06M is a structural dummy variable that equals 1 from June 2006 onward (0 prior to June 2006); SD17Y01M is a structural dummy for January 2017 onward; and SD22Y08M is a structural dummy for August 2022 onward.
A multiple breakpoint test identified structural changes in June 2016, January 2017, and August 2022. Following the surge in export volume to countries such as Vietnam, Taiwan, and the United States in June 2016, the export unit price to other countries fell by 33.2%. After January 2017, the export unit price increased by 19.8%, but declined again by 16.6% after August 2022.
To evaluate the predictive performance of the model, several commonly used indicators were considered, including the Mean Absolute Percent Error (MAPE), Mean Squared Percentage Error (MSPE), Mean Squared Error (MSE), Root Mean Square Percent Error (RMSPE), and Theil’s Inequality Coefficient (Theil’s U). Among these, MAPE, RMSPE, and Theil’s U are frequently used to measure the relative size of prediction errors against actual values because they are not affected by the scale of the variables (Kim et al., 2018). This study employed MAPE, RMSPE, and Theil’s U as the primary criteria to assess the forecasting accuracy of the abalone supply-demand model.8
The predictive accuracy of the model was assessed using both in-sample and out-of-sample error metrics. In-sample errors were calculated for each behavioral equation using data from August 2023 to May 2024. Table 13 presents the in-sample results, evaluated using MAPE, RMSPE, and Theil’s U for each behavioral equation. Overall, the model demonstrated satisfactory predictive performance, with most equations exhibiting low error levels. In particular, all behavioral equations—except those related to export volumes to other countries—achieved strong predictive accuracy, with MAPE values ranging from 2.1% to 8.7%.
Relatively lower predictive accuracy observed in certain equations appears to stem from limitations in the availability of relevant exogenous data. In particular, export volumes to countries other than China exhibited a high MAPE of 30.6%, reflecting considerable forecast error. This result likely stems from the model’s inability to adequately capture the heterogeneous and dynamic nature of these markets. Export volumes to such destinations are often subject to abrupt and irregular fluctuations. Moreover, aggregating these countries into a single residual category may obscure distinct market behaviors and distort estimated responses to price and macroeconomic variables. These findings underscore the importance of disaggregating export destinations and incorporating country-specific variables in future model refinements.
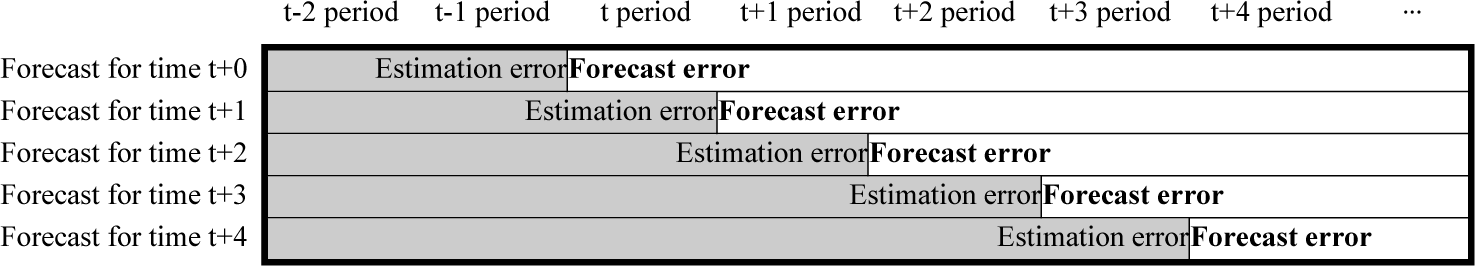
To evaluate the out-of-sample forecasting performance of the abalone supply-demand model, the MAPE was selected as the primary evaluation criterion. Unlike in-sample error assessment, out-of-sample error was measured by generating monthly forecasts of endogenous variables and then comparing these forecasts with the actual observed values. Specifically, the MAPE was calculated by comparing forecast values with actual observations for the period from June 2024 to March 2025.
Given that the model developed in this study is intended to produce short-term forecasts, the evaluation approach followed the structure shown in Figure 3. Specifically, the model forecasted values for June using data available through May, forecasted July values using data through June, and forecasted August values using data through July. For example, to forecast the value for June, the model used all updated actual data available through May, and the forecast for June was generated accordingly. These forecast values were then compared with the corresponding actual values to calculate the out-of-sample forecast error.
The forecasted values generated by the model vary depending on how the prediction error for the forecast month is specified. In this study, five alternative approaches were applied to determine the prediction error for the forecast month. In all approaches, actual values of exogenous variables at the time of forecasting were used to generate the projections.
The first approach assumes a theoretical error of zero, setting the prediction error for the forecast month to zero. The second approach, referred to as the “same-as-previous-month” assumption, applies the estimated prediction error from the previous month to the forecast month. The third approach uses the “same-month average,” assigning the forecast month’s prediction error as the average of the estimated errors for the same month over the past three years. The fourth approach applies the “three-month average,” using the average of the estimated errors over the past three months. The fifth approach, called the “Olympic average,” calculates the forecast month’s prediction error using the average of the most recent five months’ estimated errors, excluding the highest and lowest values.
As summarized in Table 14, Approach 4—which incorporates the average prediction error over the most recent three months—consistently demonstrated the highest predictive accuracy across most endogenous variables. This result suggests that short-term averaging methods are particularly effective in improving forecast reliability in aquaculture sectors like abalone farming, which are subject to biological constraints and seasonal fluctuations.
Among supply-side variables, juvenile abalone input volume (5.3%), grow-out stock under one year of age (4.5%), and grow-out stock over one year of age (5.1%) exhibited notably low MAPE values. These results reflect relatively stable and structured decision-making processes. In particular, these variables are determined primarily by production cycles, facility capacity, and pre-scheduled stocking plans, rather than short-term market conditions. Accordingly, the strong predictability of these variables is economically plausible, as they are largely governed by internal production systems and forward planning.
In contrast, demand-side variables—especially those related to exports—showed considerably higher forecast errors. Export volume to countries excluding China recorded a MAPE of 27.4%, the highest among all variables, while the corresponding export unit price exhibited an error of 11.9%. This can be attributed to the model’s inability to disaggregate country-specific export data. Aggregating export volumes and prices across heterogeneous markets fails to account for the distinct import conditions, consumer preferences, and regulatory environments of each country. As a result, the model falls short in capturing exogenous market-specific volatility, thereby limiting predictive performance in export-related outcomes.
5. Conclusion
The Korean abalone aquaculture industry has experienced remarkable growth, emerging as a major source of income in coastal communities (Ock, 2015). However, recent trends reveal growing concerns over declining profitability, largely driven by a mismatch between increasing production volumes and stagnant domestic and export demand (Han et al., 2020). In particular, although shipment volume has continued to grow, total production value has declined, indicating reduced total revenue driven by falling market prices. In response to elevated mortality risks associated with rising seawater temperatures, many abalone farms have shortened the grow-out period from the historical average of 36 months to approximately 18 months (Seong, 2021). This shift has led to a concentration of supply within shorter time frames and an increase in overall production volumes, thereby aggravating market oversupply and placing additional downward pressure on prices.
To effectively respond to evolving supply and demand conditions, decision-making must be grounded in scientific and objective data rather than relying solely on past experience (Han et al., 2020). Structural inefficiencies in the abalone distribution system—such as the prevalence of non-cooperative shipments, requests for side payments during farmgate transactions, and the widespread reliance on informal wholesale markets—have exacerbated market distortions and contributed to price volatility. Accordingly, the development of a quantitative and reliable forecasting model is essential to support the sustainable growth of the abalone industry.
This study aims to both the explanatory power and predictive accuracy of existing abalone supply forecasting models. Although biological characteristics are incorporated through a DEEM, consistent with previous studies, this study employs a SM rather than a RM. A well-designed forecasting model should not only produce accurate future projections but also enable scenario-based policy simulations (Lee, Heo, and Ha, 2019). The proposed model is developed with both of these objectives in mind.
The model determines the equilibrium producer price under the market-clearing condition where total supply equals total demand. On the supply side, the model incorporates behavioral equations for seedling (juvenile abalone) input, grow-out stocks categorized by age (under one year and one year or older), and shipment volume. On the demand side, equations are specified for per capita demand, export volume and price to Japan, and export volume and price to other countries (excluding China).
Consistent with previous studies, juvenile abalone input volume is estimated at the national level without regional disaggregation. The estimated coefficient for the average producer price of 10-piece abalone—calculated over the period from November of the previous year to April of the current year—is 0.1%. Departing from the approach used by Han et al. (2020), the grow-out stock is disaggregated into two distinct age categories based on recent empirical distributions: abalone under one year of age and those one year or older. With regard to shipment volume, previous studies attempted to convert weight-based data into quantity-based estimates by employing size-to-weight conversion formulas (Cho, Choi, and Kim, 2016) or age-based conversion standards (Han et al., 2020). However, such methods rely on outdated sample survey data and may not adequately capture recent changes in market structure or consumption trends. Therefore, this study estimates total shipment volume in aggregate form, and identifies a pronounced seasonal concentration of shipments during the summer months, a period associated with heightened mortality risks due to rising sea temperatures. The estimated price elasticity of demand is –0.4, indicating that the demand for abalone is relatively inelastic. Income elasticity was estimated at 0.3, suggesting that abalone is regarded as a normal good, with demand exhibiting moderate responsiveness to income changes. On the export side, the model distinguishes between shipments to Japan and those to other countries excluding China, and separately estimates corresponding export unit price equations. This disaggregated approach represents a methodological advancement over previous studies, which did not account for such differentiation in export markets.
To assess the forecasting performance of the proposed model, both in-sample and out-of-sample forecast errors were evaluated. With the exception of the export equations, all behavioral equations exhibited MAPE values below 10%, indicating a generally high level of predictive accuracy. Among the export-related equations, the model demonstrated relatively large errors in forecasting shipments to other countries. This limitation is primarily attributable to the inherent volatility in exports to these markets, which is difficult to capture with the current model specification. Notably, the coefficient of variation for exports reached 102%, indicating substantial fluctuations. To address this issue, future research should incorporate more granular trade indicators as they become available, thereby enhancing the model’s explanatory power and predictive accuracy.
Out-of-sample errors were assessed by generating monthly forecasts of endogenous variables and comparing them against actual observed values. The most accurate forecasts were obtained when the prediction errors for each target month were adjusted to reflect the average error observed over the preceding three months. Similar to the in-sample results, most behavioral equations in the out-of-sample forecasts exhibited low MAPE values, ranging from 4.5% to 13.9%, indicating a satisfactory level of predictive performance. However, the MAPE for exports to other countries was relatively high at 27.4%, reflecting limited predictive performance. Exports to these markets reached 125 metric tons in March 2025, marking a 200% increase from the previous month—an abrupt shift that could not be anticipated by the existing model specification. This underscores the need to refine the model’s export component by incorporating real-time trade dynamics and more responsive explanatory variables.
Although this study primarily focused on refining the structural specification of the abalone supply-demand model without implementing policy simulations, the proposed framework is expected to serve as a valuable tool for future policy analysis through scenario-based simulations. Future research is encouraged to analyze policy effects by setting various scenarios, such as changes in tariffs or export volumes. In addition, if monthly disposable income data become available, incorporating them into the model is expected to enhance the explanatory power of demand-side factors. Recently, exports to countries such as Vietnam, Taiwan, and the United States have been increasing; with more data, disaggregated analyses by destination country are expected to further improve the model’s predictive accuracy.