


1. Introduction: Places and Flows in Urban and Maritime Networks
Intercity linkages have been the focus of numerous works in geography and elsewhere during the past decades (Derudder and Neal, 2019 ; Peris et al., 2018; Pflieger and Rozenblat, 2010). The theories and paradigms supported by these approaches were accompanied by a wide array of empirical investigations. Various communication networks were used as proxies of intercity relationships. Since the 1950s, such studies dominantly focused on planar graphs, such as roads and railways, until their extension to airlines and firms’ networks (Ducruet and Beauguitte, 2014). Network indices and accessibility measures were used to summarize the shape of the urban system and the situation of cities within those systems, from national to continental and global scales. The analysis of such networks is, nowadays, a dynamic field of research that continuously expands through cross-disciplinary methods (Derudder, 2019).
However, in a world where maritime transport continues to carry most of its trade – more than 90% of total volumes according to UNCTAD (2020), the absence of research on intercity maritime flows remains striking. Just like urban network research ignored shipping, maritime network research ignored urban places. One and only exception is Simmons (1970) who analyzed inter-provincial flows in Canada of which shipping tonnage. In their review of port geography publications since 1950, Ng and Ducruet (2014) underlined a fading mutual interest between port geography and human geography. The spatial and functional separation of ports and cities, early described by Bird (1963) as a general process, has been influential in such respect. It had the effect of shifting the attention towards the micro-level of the waterfront or port-city interface.
In maritime network research, the unit of analysis is traditionally the port or the port terminal, not the (port) city. Despite early applications of graph theory to maritime flows (Robinson, 1968), no discussion was proposed in relation to urban development. The absence of ports in urban network studies can be explained by the fact that the maritime network is one segment only of a global, multimodal value chain (Robinson, 2002). Thus, the port city itself may not always be the true origin or destination of maritime flows, and therefore not the relevant “node” in the network. Mapping and analyzing intermodal networks is possible using customs and trade data such as for the United States (Shen et al., 2020), but this exercise remains impossible at the world scale due to the lack of a comprehensive database. Another explanation is that maritime networks are somewhat volatile, given the irregularity of tramp shipping for bulks, the seasonality of cruise itineraries, and the footloose character of container transshipment. Port hierarchies may wax and wane according to multiple selection factors, in a competitive environment.
This article wishes to push further the study of maritime flows in relation to cities. We propose a case study of ports of the world where nodes are city-regions and links are vessel movements between them. To what extent is the maritime network an urban network? Are maritime flows and connectivity determined by urban regularities? The analysis of vessel types shall shed new light on longstanding issues in urban geography, namely the diversified character of larger cities (Ducruet, 2020a; Duranton and Puga, 2000). The rest of the article is organized as follows. We first review in Section 2 how port connectivity has been analyzed in geography and elsewhere, especially with regards to the territorial or urban environment of the connected ports. The third section constitutes the core of the analysis, by measuring the intensity of port-city linkages and testing the urban dimension of the network’s features in term of multiplexity and connectivity. In conclusion, we discuss the outcomes of this research and their contribution to urban, network, and maritime studies.
2. Maritime Networks as Urban Networks
Geographers have long been interested by the overseas linkages of ports, under the concept of maritime forelands. Forelands are defined as the overseas connections of a given port designed by maritime routes (Weigend, 1952). Numerous studies of forelands were proposed to understand ports’ “trading areas” based on traffic shares and specialization indices. A commonality was to focus on one single port or country, so that a global picture remained missing. Other studies looked at the service distribution of individual ocean carriers and shipping alliances. Very few quantitative analyses of maritime networks were proposed until natural sciences investigated this particular field in the late 2000s. The main driver had been to check for the existence of scale-free and small-world properties in relation to general models (Ducruet, 2020b for an extensive review of the field). Geographers followed such pathways, using a complex network framework to shed new light on port connectivity, network vulnerability and robustness, and the emergence of communities, often through an interdisciplinary effort.
It is only very recently that a shift from port to port city and even port region was proposed. The discovery of untapped historical shipping records permitted innovative analyses of cities and maritime flows over 120 years and globally (Ducruet et al., 2018). It revealed the dominance of the largest cities despite the decline of the correlation between urban population and vessel traffic. The correlation, however, increased at the level of city-regions, which was interpreted as the impact of port-city physical separation, which was compensated by the development of land (road) transport. Another study focusing on containerization demonstrated the reinforced gravity underlying intercity maritime container flows (Ducruet et al., 2020).
However, existing studies still face certain lacks that need to be filled in order to verify how urban are contemporary maritime networks. In methodological terms, the study Ducruet et al. (2018) had the advantage of addressing long-term trends but it relied on the counting of ship calls, ignoring ship size. While Ducruet et al. (2020) considered the volume of flows, their study only focused on containerships, which represent only about 12% of the current world fleet. Thus, the present research proposes an all-encompassing analysis of the global maritime network considering all vessel types and their tonnage. This approach shall be completer and more realistic, especially when it comes to reveal the urban determinants of shipping flows.
3. A Global Analysis of Cities Linked by Water
The chosen maritime dataset is an extraction from the Lloyd’s List Intelligence database, which is highly representative of global shipping – approximately 80% of the current world fleet. The choice of the period (1977–2008) is dictated by data cost and availability. While Lloyd’s digital data does not go back in time prior to 1977, printed documents do not systematically report the type of ships before this date. We are aware of the relatively outdated character of the ending year 2008. However, it makes the study period relevant as it lies between the global diffusion of containerization, China’s Open-Door Policy (late 1970s), and the global financial crisis of 2009, which had enormous impacts on trade and shipping. An analysis based on 32 years of observation is believed to suffice to shed new light on the evolution of port-city relationships from a global network perspective. The database comprises 3,760,823 vessel movements connecting no less than 5,824 ports. The 159 original vessel types were aggregated into 20 categories to better reflect the diversity of maritime trade. Yet, shipping data is not trade data, as it does not offer a precise breakdown per commodities nor does it provide the value and exact quantity of the transported and handled goods.
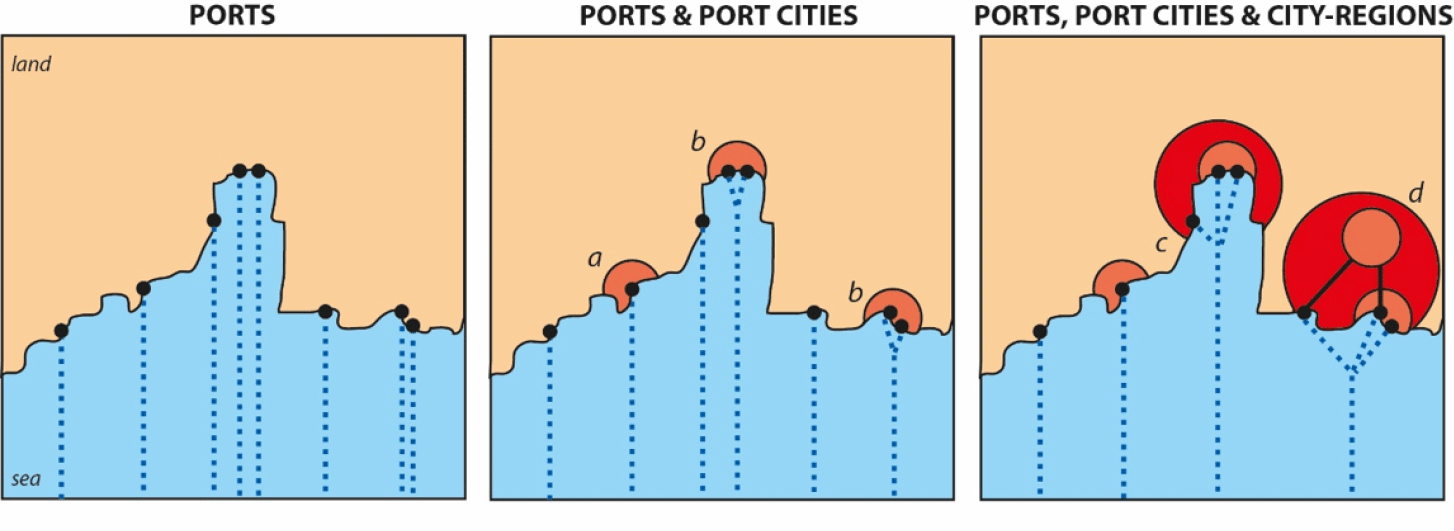
One way to get the analysis closer to the reality of maritime flow distribution has been to shift the focus from port to port city and city-region (Figure 1). As shown in the figure, ports were first attributed to port cities depending on the extent of urbanization (a), which in some cases involve the merger of ports belonging to the same port city (b). In the next step, city-regions are defined as the largest city near the port, should it be coastal (c) or inland (d). This shift is important as it gives privilege to the dominant urban center, which is susceptible to be the true engine of flows rather than the port city itself, which may in fact be a gateway rather than a “central place” (Bird, 1977). Ports situated within the radius of the city-region are merged with each other to form one single entity. This radius is defined by spatial proximity (i.e., a maximum range of 200 kilometers), land transport connectivity, absence of high elevation and of political border between port and city. There are, of course, cases that cannot be captured by this methodology. Cities located far inland, such as in landlocked countries like Austria (de Langen, 2004) belong to the “contestable hinterland” of several ports that compete to gain markets shares. It is also the case of Greater Paris, both captured by Antwerp in Belgium and by the Seine Axis with Rouen and Le Havre (Merk et al., 2011). Yet the fact that more than 60% of the world’s population resides within 100 kilometers from the coast motivates our analysis.
From the original port database, we obtained 3,518 ports, port cities and city-regions after node aggregation. In the end, the number of inhabitants was obtained from existing global urban databases on agglomerations1 , while maritime traffic is measured in deadweight tonnage, the carrying capacity of vessels multiplied by their call frequency.
Our first results (Figure 2) provide interesting evidence about the degree of overlap between port and urban hierarchies. As shown in the figure, the population of city-regions is much more correlated with traffic than the one of port cities. This demonstrates the usefulness of the aggregation, as it manages to catch a noticeable proportion of inland markets served by ports and of maritime traffic serving main cities. The correlation for city-regions is nearly two times higher for city-regions, and this gap has been stable over time. Another interesting trend is that the correlation based on weighted traffic2 is significantly higher than for raw traffic (dotted line), given its closeness with value instead of tonnage. The fact that about 60% of world maritime traffic is statistically explained by urban population confirms the relevance of our approach. The unexplained 40% can relate to the aforementioned factors of which sea-land (gateway) and sea-sea (hub-and-spokes) transshipment that concentrates at particular places, regardless of city size.
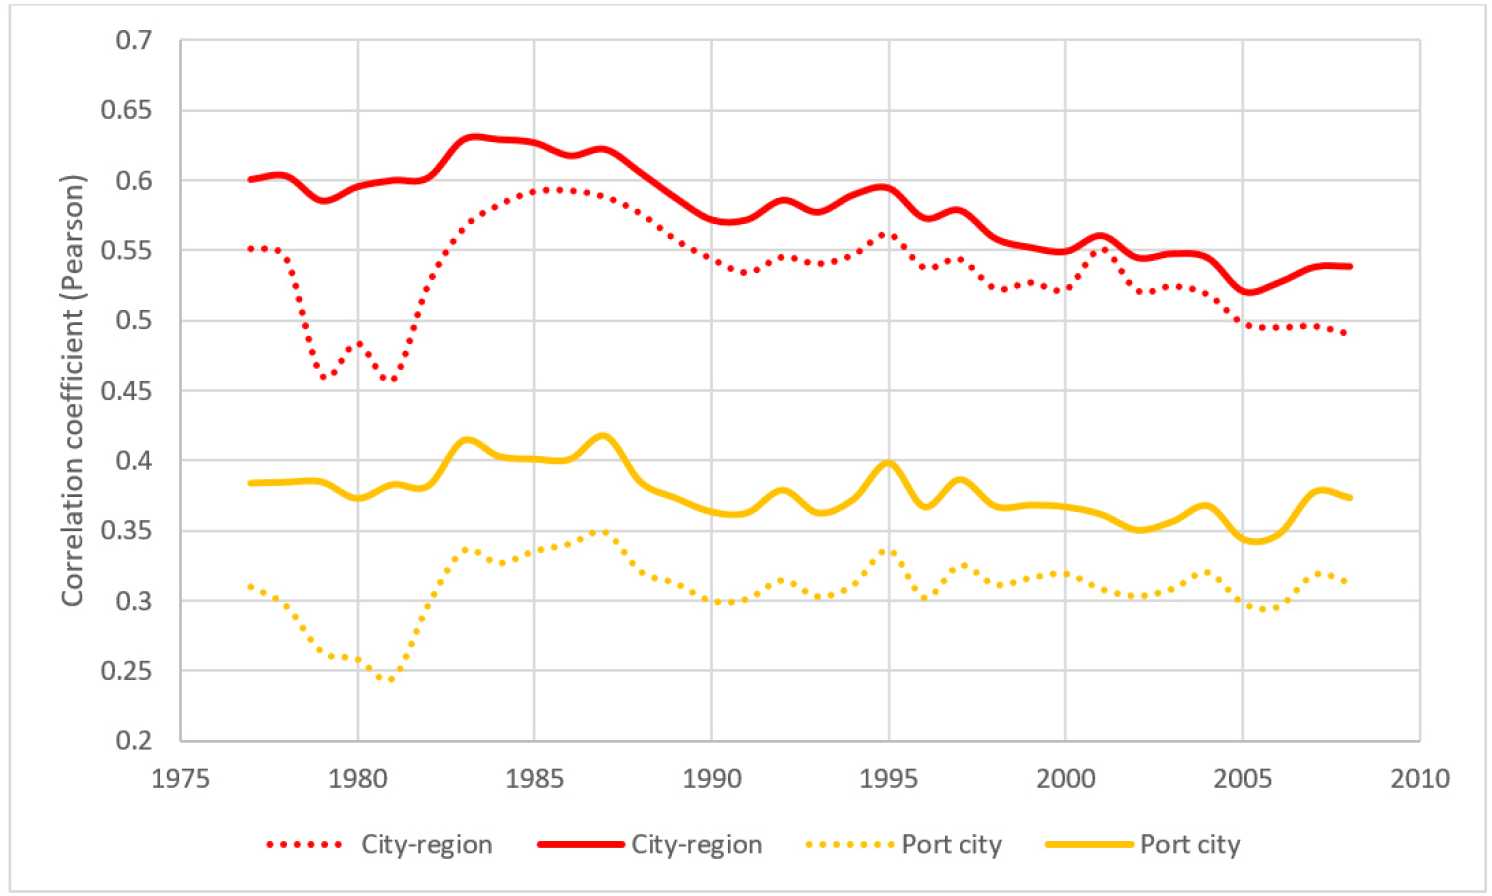
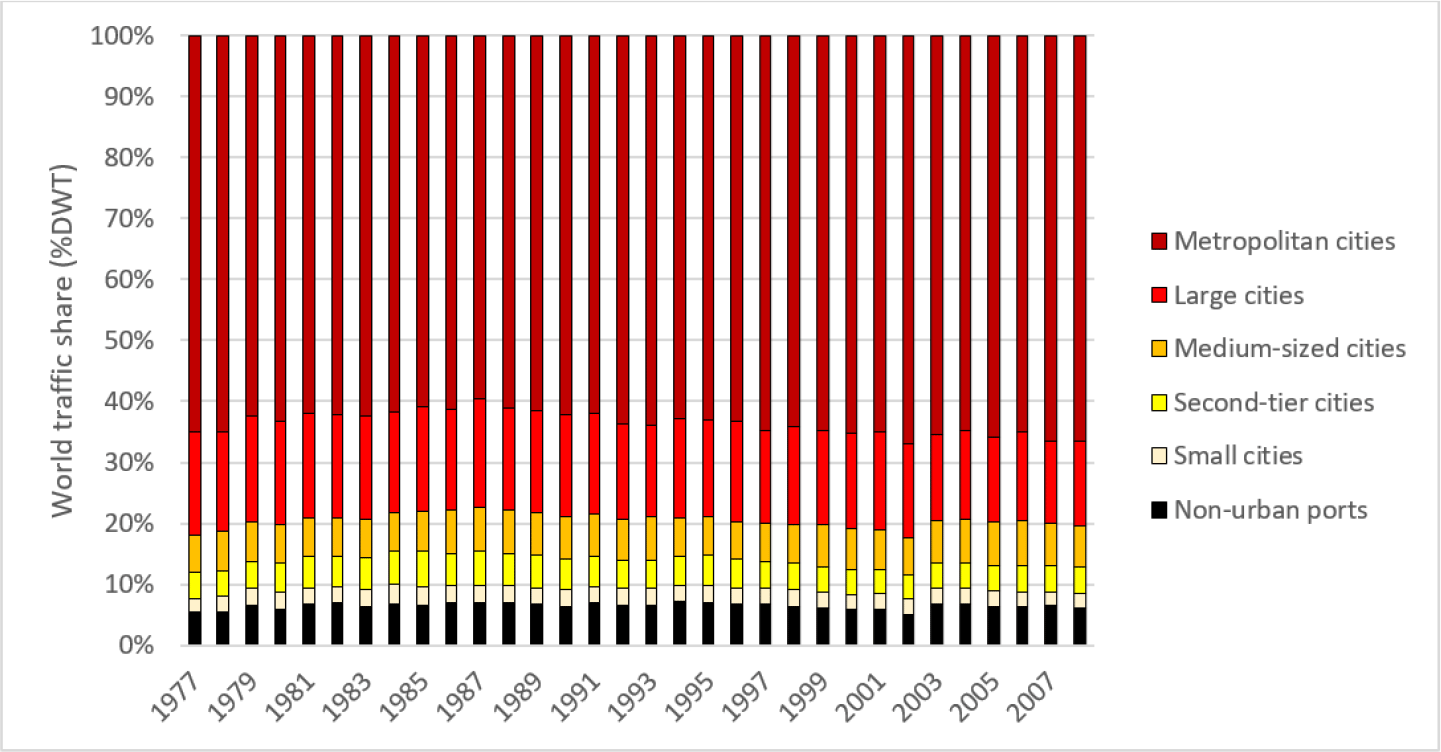
Such factors are potentially responsible for the slight but continuous decrease of the correlation, from 0.60 in 1977 to 0.54 in 2008, leading to ineluctable port-city separation physically and functionally. During this period, land transport connectivity has greatly expanded in numerous regions, with the effect of shifting traffic to the best-connected port nodes on the land side (Hoare, 1986 for an early observation). The trend of port regionalization, by which seaports develop inland distribution centers and services, is an ultimate stage in this respect (Notteboom and Rodrigue, 2005). Nevertheless, such correlation dynamics may be influenced by a few outliers. This motivated a look at the distribution of vessel traffic by city size classes (Figure 3)3. From such a perspective, the largest cities (cf. metropolitan cities) maintained, on average, a disproportionate share of world traffic along the period. This class concentrated no less than about two-thirds of global traffic in a relatively constant manner. Together with “large cities”, this proportion reaches 80%, leaving far behind the three other classes. Interestingly, the class of “non-urban ports”, although it handles less than 10% of total traffic on average, has a comparable share than that of “medium-sized cities”.
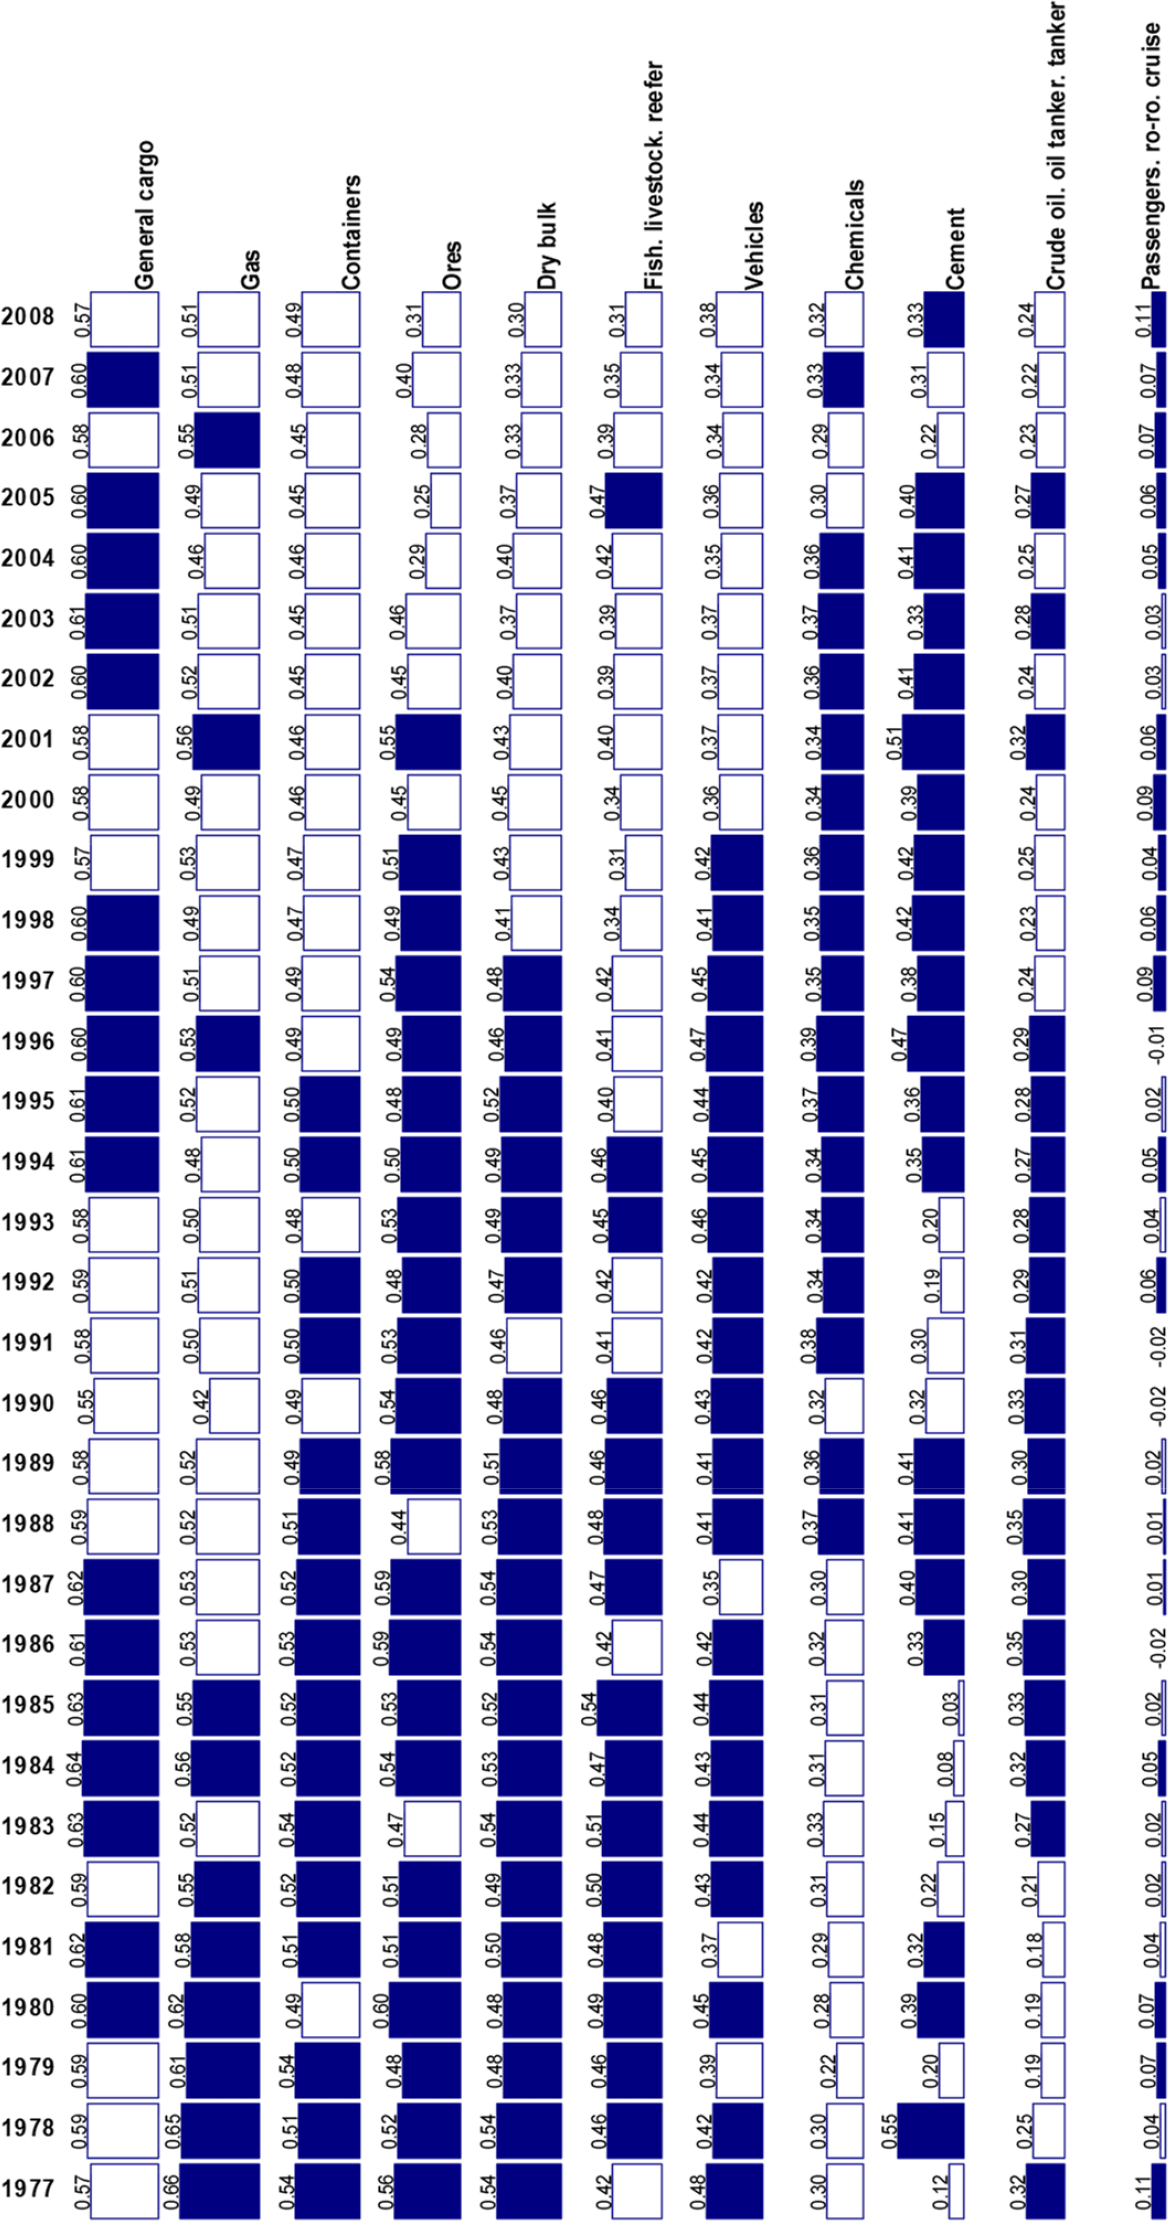
The architecture of the maritime network can also be envisaged as multiplex, i.e. as a system made of layers that are more or less overlapped. A look at the correlation per vessel types provides a more precise view of the relationship between maritime flows and urban hierarchies (Figure 4). While all categories contribute in some way to the local economy, general cargo is the most significantly correlated with city size, and this is constant over time. General cargo (or breakbulk) is a wide category that includes all sorts of semi-finished goods, from metal plates to plastics and other non-containerized products. Also, general cargo is the most labor-intensive traffic with regards to the workforce employed at the docks (Charlier, 1994). It is followed closely by containers (finished, manufactured goods) and vehicles, together being the most valued categories. City-regions thus concentrate high-value goods in ways proportional to their size, although the correlation has somewhat faded in the late period and the values remain moderately significant overall. But in relative terms, such categories are much more urban-oriented than passengers (cruise, ferry) and specific intermediate inputs such as wood and asphalt. Among the other categories having a significant relationship with city size are liquid gas, ores, dry bulks, food products (i.e. fish, livestock, reefer), and chemicals. Such traffic relates more with the “metabolism” of cities as it fuels their growth as consumption centers. Cement as well can be counted in this list, but also oil-related traffic, both keeping some importance in the late period for the same reason than cited above. Passenger-related traffic including ferry, cruise, and roll-on/roll-off is the least significant category, as such traffic is less explained by city size than by other features such as inter-island or inter-coastal proximity, seasonality, and local/regional amenities (e.g. climate, architecture and heritage, tourism).
The confrontation of multiplexity with city size (Figure 5) provides more clue about the role of the urban factor in shaping such an architecture. Two indices were calculated by urban population percentile: the average number of traffic types (a) and the traffic diversity index (b) (Duranton and Puga, 2000)4. In both cases, the higher the index, the more diverse is the traffic, and the more likely is the port (city) to exert strong connectivity in the global maritime network (Ducruet, 2020b). Without any doubt, traffic diversity is extremely sensitive to city size. The first index (a) shows that metropolitan cities handle 8-9 traffic types on average, two times more than the world average all places included. The bigger the city, the higher the diversity. Such an evidence echoes traditional perceptions in urban geography and regional science, where larger cities develop a wider portfolio of activities than smaller cities. Non-urban ports are the most specialized, as they handle only around 2 layers (traffic types) on average, compared with small cities (3 layers), second-tier cities (4), medium-sized cities (5), and large cities (6-7).
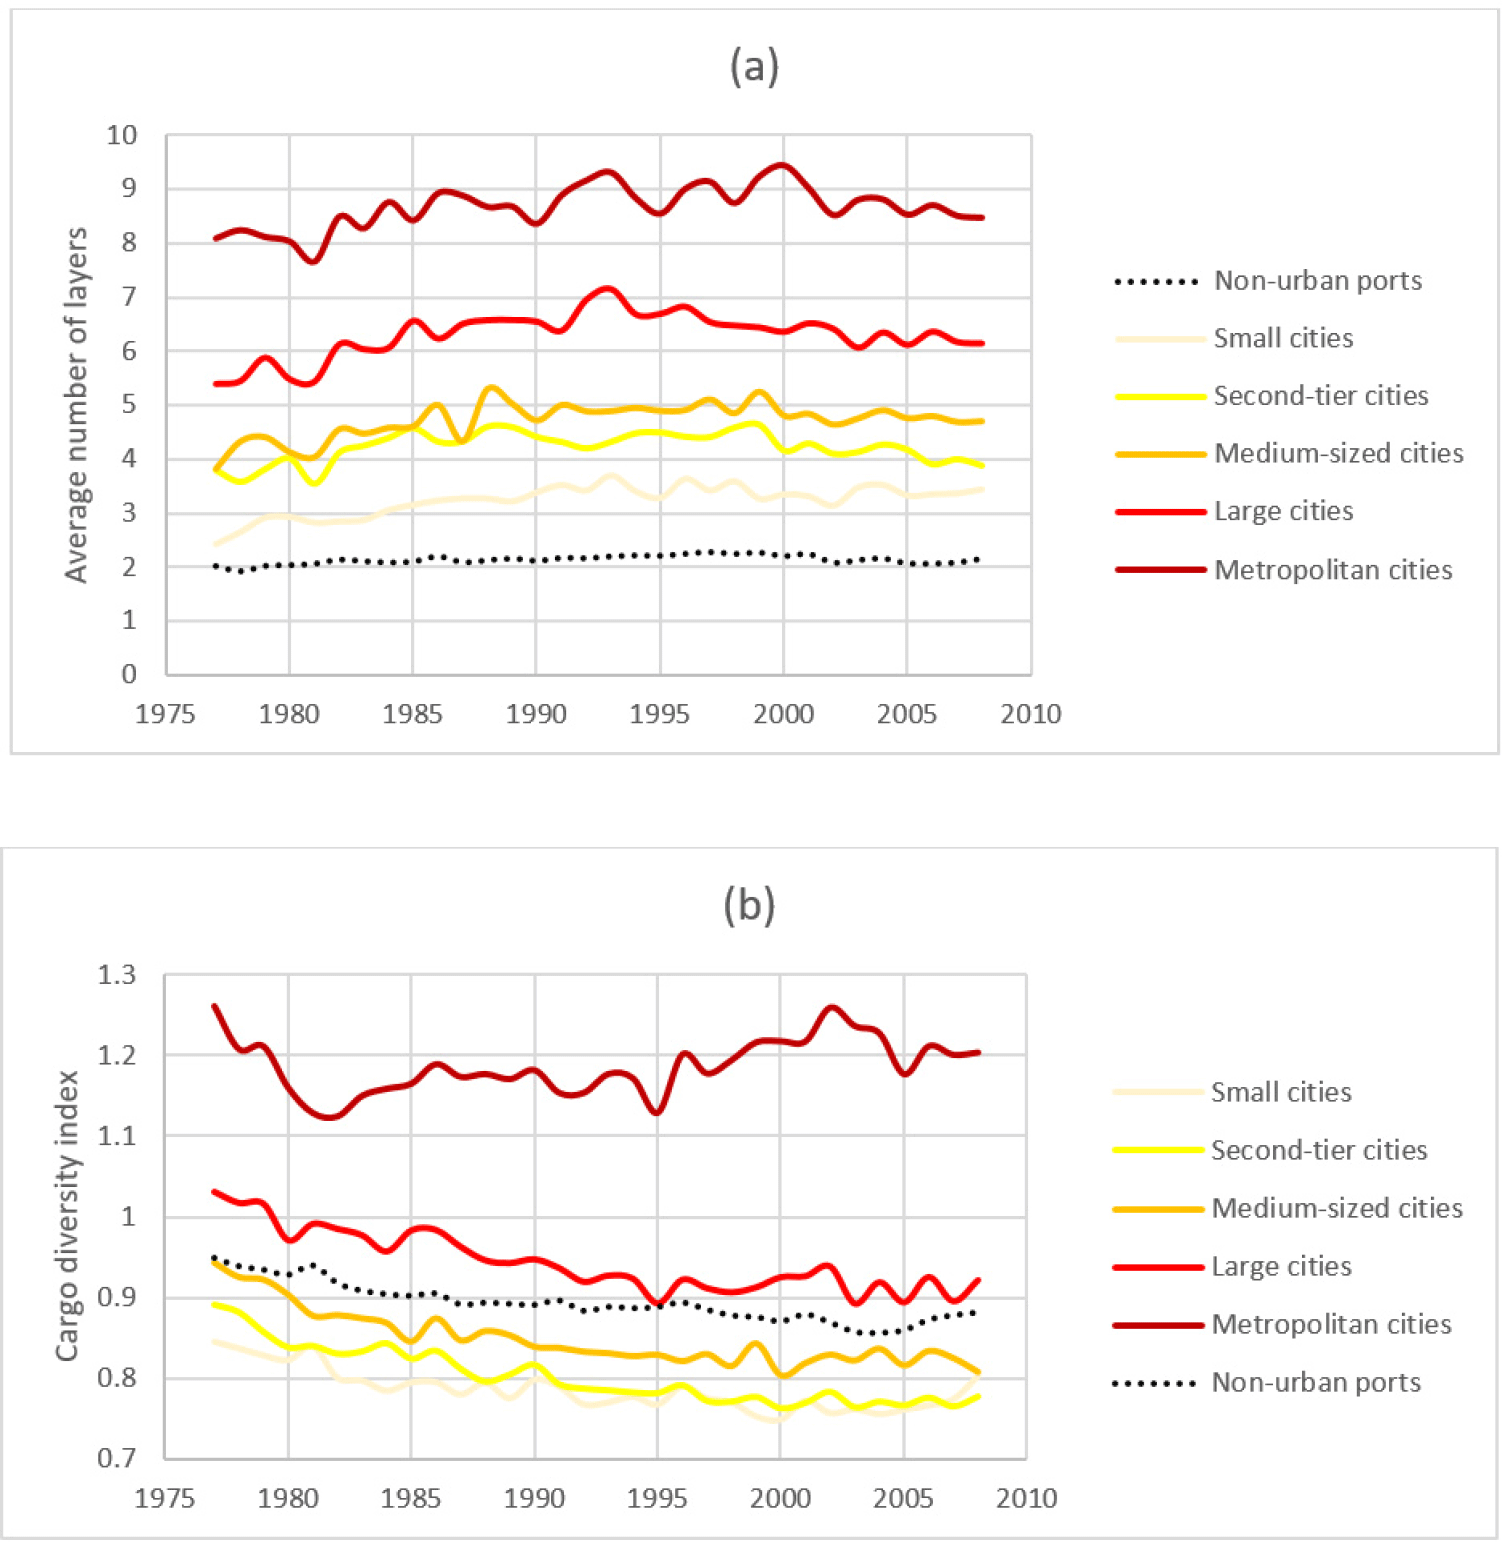
Because the (a) index does not take traffic size into account, we propose the (b) index, an inverse value of the index proposed by W. Isard (1960), based on traffic volume shares. While the (b) figure much resembles the (a) figure, two aspects keep them distinct. First, there is a wider gap between the class of metropolitan cities and the other classes. Second, non-urban ports exhibit a higher diversity than small, second-tier, and medium-sized cities. Another interesting difference is that the largest cities, despite a drop of the index in the early period, increased their traffic diversity over time while all other classes diminished.
The measurement of centrality indices is one first step into the analysis of maritime connectivity in relation to cities. Four centralities are retained, which are amongst the most common in social network analysis and complex network research (Kanrak et al., 2019). Each of them expresses a different function and scale of connectivity. Betweenness centrality stands as a global measure of accessibility, defined by the number of shortest paths passing through each node. Closeness centrality is another global measure that translates the topological proximity to all other nodes in the graph. It is calculated as the inverse of the maximum topological distance from each node to all other nodes in the graph.
Degree centrality and clustering coefficient are local measures, considering the connections among directly connected neighbors. The degree is simply the number of adjacent neighbor nodes, while the clustering coefficient is the fraction of connected neighbors in the maximum possible number of connected neighbors. For the latter index, keeping zero value unchanged, we calculated the inverse clustering coefficient, as an index of hub power. The higher the degree or the (inverse) clustering coefficient, the more likely the node plays a hub role towards its adjacently connected neighbors.
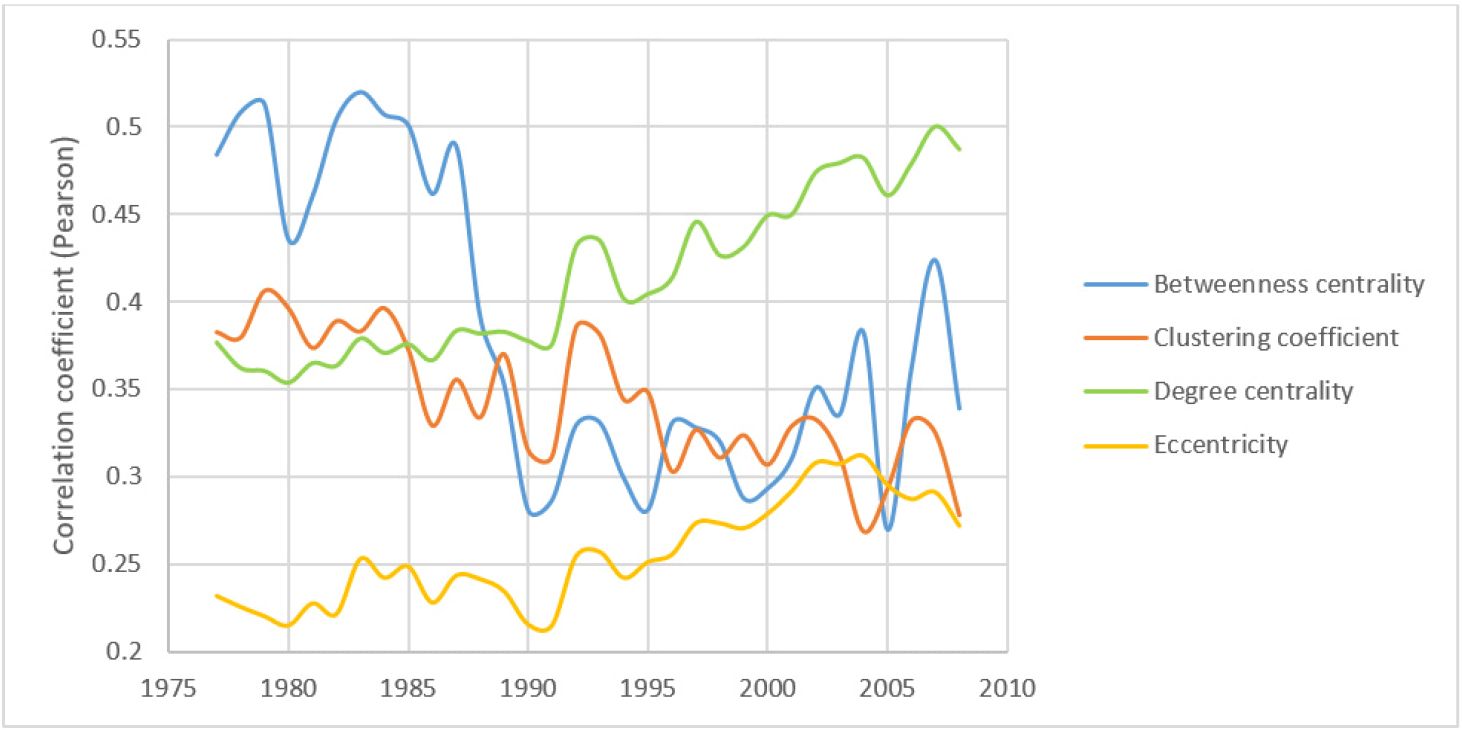
In Figure 6, the correlation between centrality measures and urban population is far from being as straightforward as was total traffic and multiplexity. Degree centrality and closeness centrality, despite their inherent differences, exhibit a very similar increasing trend. Yet, while degree shifted from slightly significant to moderately significant, closeness centrality remained only slightly significant, from 0.23 in 1977 to 0.27 in 0.28. Comparatively, the degree increased its correlation from 0.38 to 0.49, being the most significantly correlated index from the 1990s onwards. This is because betweenness centrality, quite significantly correlated with the urban hierarchy in the early period, witnessed a rapid shrink of correlation in the late 1980s, oscillating around 0.32 since then. The maritime “hub power” of cities, the clustering coefficient, had been only moderately significant and even lost in significance along the entire period, from 0.38 in 1977 to 0.28 in 2008. Such evolutions point to a fading global accessibility and hub power of cities, in parallel to an increased importance of proximity ties.
When envisaged as average values per city size classes, such centralities offer a drastically different picture, however (Figure 7). We observe a systematic fit between centrality and city size, as average values increase along with the number of inhabitants. Non-urban ports always score the lowest among all classes, while metropolitan cities stand far above the other classes as seen by the enormous gap even with large cities, except for closeness centrality. Average scores lower the probability for “anomalous centrality” to occur (Guimerà et al., 2005), such as high centrality at smaller cities and low centrality at larger cities. Testing such “anomalies” would run beyond the scope of this paper given the length of the study period and the global scale under examination.
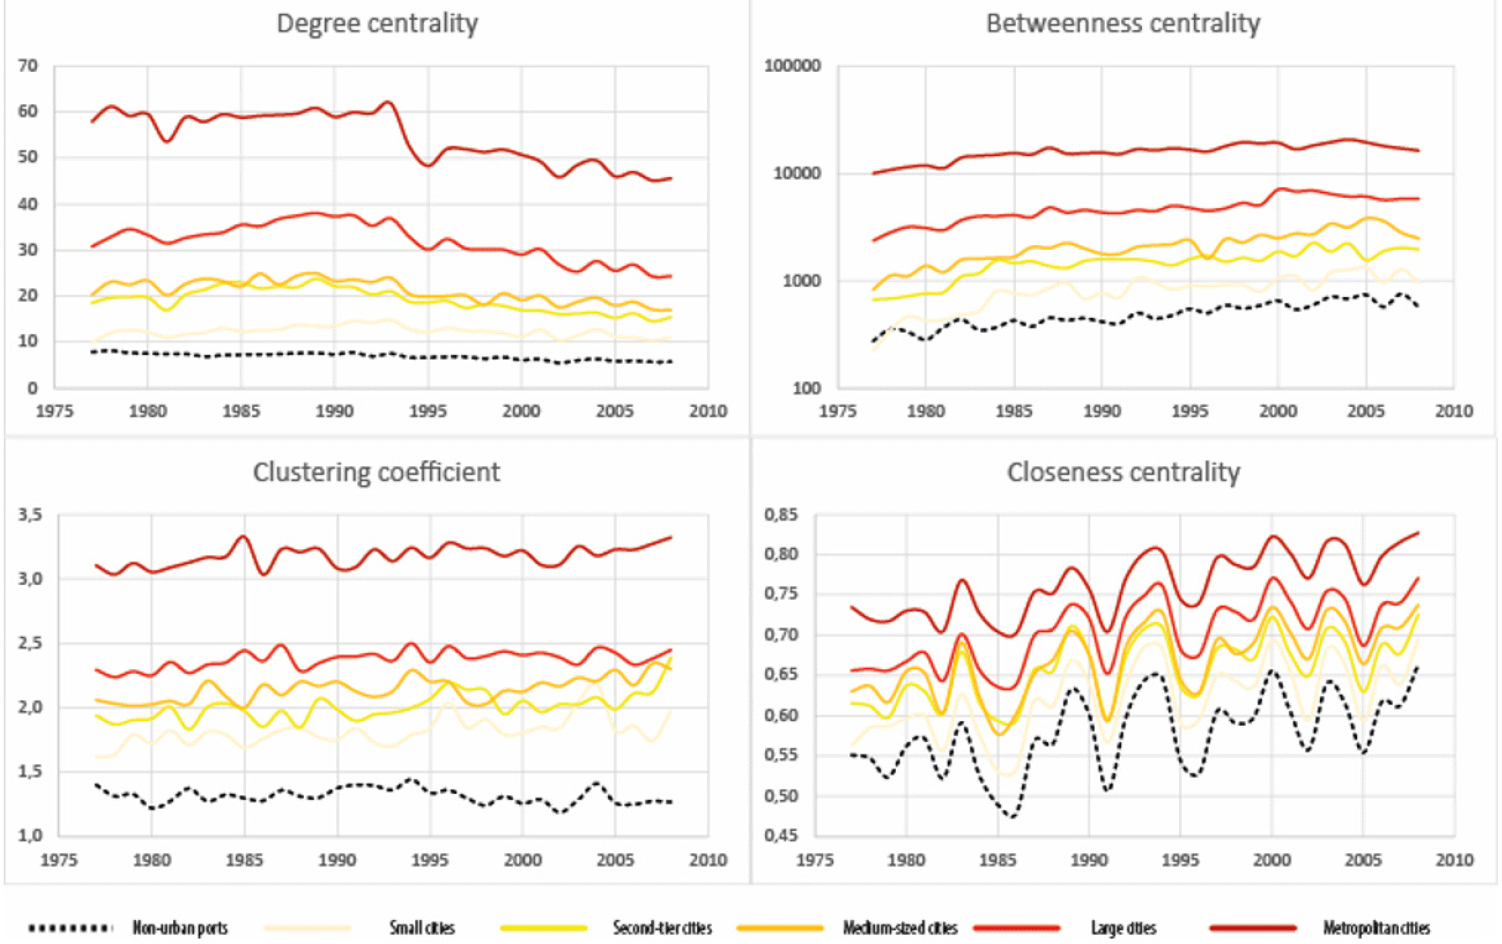
More important is to note that the well documented shift of maritime centrality from traditional port cities to modern transshipment hubs is not apparent in Figure 7. Non-urban ports have never surpassed the smallest cities in terms of centrality. One likely reason is that “pure transshipment hubs” locating away from cities remain relatively few cases across the globe. In the container sector, major hubs still remain anchored in large cities, such as Kingston (Jamaica), Rotterdam, Hamburg, Algeciras, Taranto, Piraeus, Colombo, Singapore, Hong Kong, and Busan. Such cities have at least a few hundred thousand inhabitants if not several millions. The development of new container terminals, such as Fos, Tangier-Med, Voltri, and Yangshan, still remain in close proximity to the urban core, in such cases Marseilles, Tangier, Genoa, and Shanghai respectively, as integral elements of urban development and even global city making (for more in-depth case studies see Frémont and Ducruet, 2005; Mohamed-Chérif and Ducruet, 2016; Wang and Ducruet, 2012). Another likely reason for non-urban ports to score so low is their location within tiny urban settlements for which demographic data could not be collected. This lack of data could not allow us to distinguish amongst zero population and negligible population.
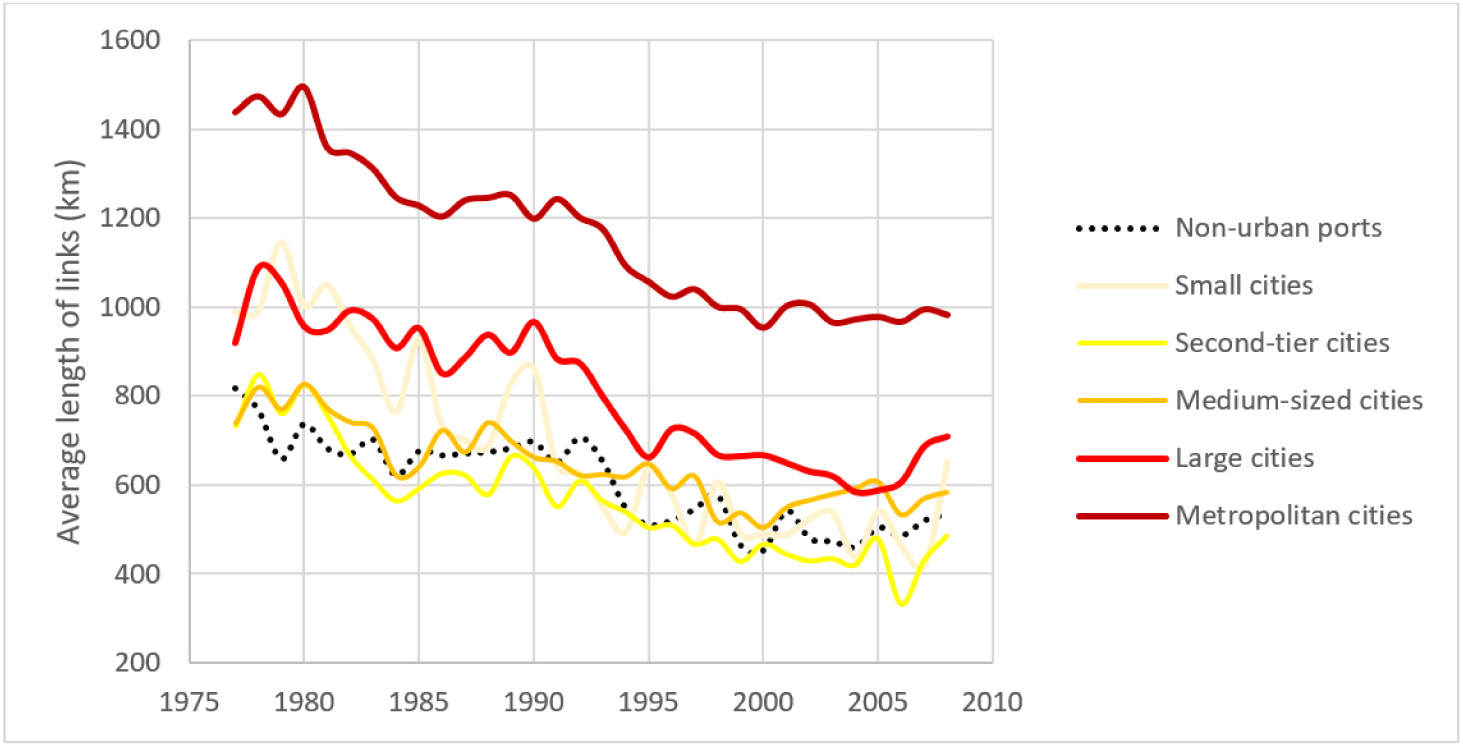
Falling in the category of “spatial networks”, the maritime network needs time and cost to travel its links (vessel voyages) and to create and maintain its nodes (ports) (Barthelemy, 2010). In this paper, the average distance of a city’s links with other cities can be regarded as an important indicator of connectivity. While the correlation between degree centrality and link distance had been demonstrated in the case of air transport (Guimerà et al., 2005), no study has ever tested this dimension from a city size perspective. Various schools of thought long underlined the ability of larger cities to reach more distant markets than smaller cities, in accordance with the central place theory (Ullman, 1954). Figure 8 offers mixed evidence about the maritime case. On the one hand, it is indisputable that the largest cities, metropolitan cities, largely dominate other cities by the geographic extent of their connectivity. Although the average length of their links had diminished over time, it is also the case for other classes, and the gap between metropolitan cities and other cities had remained similar. Large cities, the second class, is almost always following metropolitan cities, underlining a good fit between city size and distance. On the other hand, figures become more complicated for smaller cities. The smallest cities (last class of urbanized settlements) even scored higher than large cities (second class) in the early period, and despite some fluctuations, remained at similar levels during the rest of the period. Non-urban ports as well tended to connect at farther distance than small cities and second-tier cities.
4. Conclusion
This article demonstrated that port-city relationships, fading in certain places at certain times, had been somewhat underestimated. When shifting the focus from port city to city-region and micro-scale to global scale, maritime networks appear as true urban networks. The volume, diversity, connectivity, and geographic scope of traffic concentrate at the top of the urban hierarchy. Non-urban ports, of which modern terminals designed to operate more efficiently than congested port cities, appear as peripheral. This is not to say that the port-city separation did not occur, as it is widely documented in port geography and elsewhere. New port terminals having poor local socio-economic effects are frequently developed to serve the interests of global supply chains actors. What our study shows is that physical separation does not mean an absence of relationship. Such terminals, for a large part, remain located in proximity to an urban core. They are part of a transport system in a constant evolution but which inherits its structure from long-term urban regularities. Cities remain essential to maritime flows as they constitute their main raison d’être, as major production and consumption centers. Conversely cities need maritime flows, should they be coastal or located further inland, to fuel their metabolism. Material flows carried by shipping remain essential to urban life, and cannot be replaced by Internet or aviation, even in the 21st century. As rightly observed by the French geographer André Vigarié (1968): “the pattern of shipping lines is neither spontaneous nor incidental: they reflect the state of the world at a given point in time (…) they are the great arteries delivering life just like avenues providing cities with diverse activities”.
Further research pathways can be identified. Expanding the study period would serve to verify whether the observed trends for 1977–2008 are prolonged up to present day. More advanced statistical techniques, such as spatial econometrics, may help to estimate the direction of the influence, in terms of port growth fueling urban growth and vice-versa. Diving into the global network shall reveal in more detail which city-regions actually dominate the network, providing more clues about the changing geography behind the observed trends.
Our research also has several implications for practice and policy. The strong urbanity of maritime networks suggests that urban and port decision-makers should work more hand in hand instead of developing apart. The fact that maritime flows correlate more city size at city-region level than at port city level means that numerous port terminals actually serve distant cities, forcing flows to be carried by trucks in between. Such a system is detrimental to the environmental well-being of numerous localities. It also poses important issues of governance, with the modern port/terminal being often located in a different administrative jurisdiction than the nearby (if any) principal city. Thus, the search for higher logistics performance shall not hamper the objective of reduced emissions from transport, especially in areas such as Europe where more than 70% of transport flows occur by road. This shall motivate decision-makers to find a balance between efficiency and sustainability.