1. Introduction
Before 2020, there did not exist research works in shipping, logistics, economics or business, which would have seen a pandemic as a risk on the horizon concerning passenger transportation at sea. For airlines and hotels, this sort of warning was given, and risk was acknowledged due to earlier Severe Acute Respiratory Syndrome (SARS; 2002–2003) and Swine flu (2009–2010) spreads (Gong et al., 2020; Keogh-Brown and Smith, 2008; Qiu et al., 2018; Sun et al., 2021). Typically, ropax ships and operations risks were related to the ship’s navigation and supervision and staff issues or within communication with seaport management and unknown movements of ships at the port area (e.g., Endrina et al., 2018). Collision of the ship with a dock or other ship is always an issue to be taken care of in risk management. However, risk management research did not consider business risks and the rapid deterioration of passenger demand (primary revenue bearing item together with cargo in ropax ship). Within European Union (EU) area, people have been used to own easy access to foreign countries and having no border formalities whatsoever. Same applied worldwide pre-Covid-19 (Coronavirus disease 2019). After Covid-19 took off, people got used to country borders and travel restrictions again, and these even existed inside their own country (counties or city regions under lockdown). The travel industry is very much dependent on freedom of movement and travel safety. Therefore, it has been relatively easy to foresee that the return of, e.g., older people to travel chains will take a long time (even if the current disease spread would diminish suddenly). People, especially risk groups, shall carry a cautious approach for a long time due to applied measures during pandemics (creating long-lasting fear), especially on public transportation modes and travel chains combining these modes (e.g., Christidis et al., 2021).
In earlier research, ropax ships have been identified as highly emitting transportation units (Christodoulou et al., 2021; Durán-Grados et al., 2020; Hilmola et al., 2015). However, these typically offer good connectivity for both passengers and cargo. As one solution earlier, research has found to use a slow steaming strategy at ships (using slower speed to gain significantly lower oil usage). However, it is still not widely applied (Raza et al., 2019). Also, traffic jams, roadside pollution, and road infrastructure need declines if ropax ships are used and favoured in political decisions (Morales-Fusco et al., 2018). The aftermath of demanding environmental regulation in the Baltic and North Seas (very low sulphur content allowed on ships from 2015 onwards) resulted in many North European countries’ increasing use of ropax and roll-on-roll-off (roro) ships together with trucks and semi-trailers (Hilmola, 2019). In one way, roro and ropax lost within longer distance connections; however, shorter distances experienced significant growth (Hilmola, 2019). Christodoulou et al. (2021) concluded similarly concerning future emission reduction plans that ropax/roro ships emit a lot of CO2 and will face significant competitive pressure from hinterland transports if sea transportation is required to pay for its emissions in the EU area. Therefore, it is somewhat logical to assume that possible future CO2 payments shall translate to higher transportation prices for customers. This has already happened with the changes driven by the sulphur regulation and the increasing diesel price (Raza et al., 2019). In many shipping companies, increased operating expenses were just passed to customers in a form of surcharges of incurred fuel costs (Bunker Adjustment Factor).
This research is structured as follows: Literature review concerning short-sea shipping drivers and enablers is provided in Section 2. Research methodology and environment follows in Section 3. As in Section 4 is analyzed the overall situation of ropax operators serving the Finnish market – it consists of an aggregate-level analysis of passenger amounts, freight volumes, and financial performance. In Section 5 is presented unitized freight flows to/from Finland with the main ropax partner countries of Estonia and Sweden. A similar analysis follows concerning passenger flows in Section 6. Research is concluded and discussed in Section 7, where additional future research avenues are also being proposed.
2. Short-Sea Shipping of Roro and Ropax – Drivers and Enablers
Short-sea shipping using roro or ropax vessels has been examined mostly from the freight perspective, and if passengers are concerned, research typically leans on safety issues of maritime transport (e.g., Zeng et al., 2017). However, it should be emphasized that short-sea shipping could include all the other cargo classes too, and has been most popular among EU countries (consists of one-third of intra-EU freight movements; van den Bos and Wiegmans, 2018). Based on van den Bos and Wiegmans (2018) research, usage of roro shipping in the EU area is driven by the higher amount of short-sea shipping seaports in a particular country, its road network length, and country’s smaller land area. In other words, it is mostly popular among smaller countries with good logistics infrastructure. As said earlier (Durán-Grados et al., 2020; Hilmola et al., 2015), emissions of roro and ropax ships have been on the societal agenda for years, and in most recent studies, even electricity and hydrogen are being proposed as solutions for significant emission reductions (e.g., Tapaninen and Palu, 2022; Vidas et al., 2021).
It is known that roro and ropax ships are mostly competitive because of speed and lead time reduction and are not necessarily the lowest cost compared to lift on-lift off ships (like container ships). Customers favor roro and ropax within freight transportation as their supply chains become more compressed, where chains could be managed with lower inventory levels and they are more reactive and flexible on market changes (Zheng et al., 2021). It was illustrated in the study between South Korea and Japan that the lead time advantage of roro based maritime transportation from departing seaport gate to arrival seaport gate is approx. 65%–70% lower than container ships (Zheng et al., 2021). This lead time saving arises mostly from port handling as in roro ships it is very efficient and has short duration (Zheng et al., 2021). In addition to this, time spent at sea also has shorter duration, but the difference is not so dramatic as what it is at seaport operations. However, it should be emphasized that roro and ropax freight transportation is never a low cost, and freight users of it typically have more valuable cargo to be transported (Zheng et al., 2021).
Even if roro and ropax shipping use could be connected on the technical side, especially within innovations of loading-unloading and higher speed of sea vessels, it is only the second part of the major competitiveness equation. For example, in Asia, roro and ropax usage is much lower than in Europe (also, research works are mostly done in the latter, e.g., Raza et al., 2020). The empirical study of Arof (2018) illustrates that experts consider the most critical enabler of roro shipping in South-East Asia to be the regulatory changes in the countries and regions involved. Roro and ropax shipping, to be effective and efficient, require swift border formalities with a low amount of administration and appropriate safety and security processes (the latter one also in surrounding waters). In addition, shipping agreements and restrictions need to be eased. Many experts also saw governmental financial assistance as an essential part of implementation’s early phases. Another study outside Europe area conducted by García et al. (2021) reported that roro shipping has been growing even in the Caribbean area, especially during the pandemic. It could be said that within the EU area, most of these regulatory challenges have already been resolved with political integration, and different programs are economically favouring intermodal transportation (e.g., Raza et al., 2020), and in some research works, it is currently seen as a vital or most important issue to increase the speed of vessels at sea. However, it should be emphasized that increasing speed is just one of the last phases of increasing competitiveness (Renna et al., 2021).
3. Research Methdology and Environment
Through longitudinal second-hand statistics and financial reports of companies, this research analyses the situation of ropax companies serving Finland. Data arise from companies (annual reports), national statistics and branch-specific databases of Finland and then from EU (Eurosatat) statistics. In many used datasets, observation periods ended in 2020, but in aggregate indicators, availability is for both pandemic years (2020–2021), and research uses regression models and analysis to illustrate Covid-19 effects. Regression analysis was chosen because it is one of the few applicable statistics analysis approaches in the longitudinal data series and in situations where there are numerous parameters (regressors) potentially explaining the volume or revenue development. The following are used as regressors for two variables, namely time (year) and Covid-19 pandemic era (binary, years 2020–2021). Earlier research in the freight sector has used regression analysis extensively. For example, Hilmola (2014) used it to detect factors explaining unitized/general cargo sea freight growth between Finland and Estonia, whereas van den Bos and Wiegmans (2018) used numerous potential parameters to find reasons for short sea shipping popularity in Europe. Tao and Zhu (2020) built regression models to explain the factors behind the value of time in freight transport. What is different in this research in the applying of regression analysis, is to use its outcomes to forecast passenger recovery, and year when pre-pandemic level of passenger volumes could be reached.
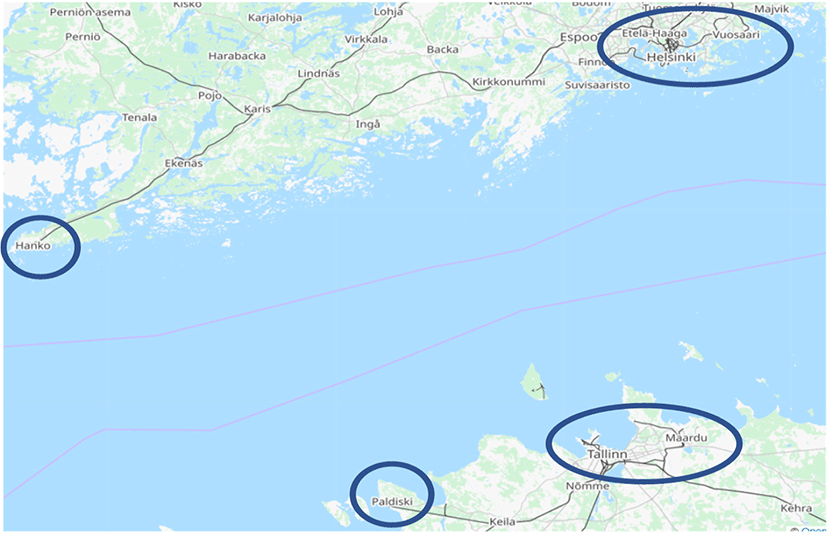
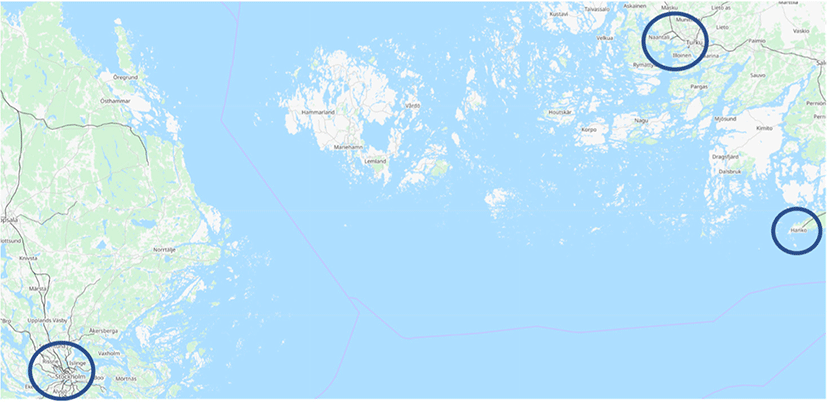
Finland is located in the North-East of Europe and is merely an island on the European map as hinterland connections exist only to Russia and within very north to Sweden and Norway. Other countries and meaningful European connections are always behind the Baltic Sea. So, short-sea shipping plays a vital role in freight flows and passenger movements together with air transportation mode. As the population in Finland is relatively small (5.5 mill.), short-sea shipping is often a combination of freight and passengers – both are needed to make operations profitable. However, combining these two makes it possible to have numerous daily connections to nearby countries, like Estonia (Figure 1) and Sweden (Figure 2). This all worked well until the coronavirus pandemic hit Northern Europe in early March 2020. After that, passenger volumes have been in turmoil, and sudden declines have followed political restrictions of lockdowns and/or very demanding restrictions to travel. Due to this, financial support has been provided for ferry operators from the local governments of Finland, Estonia and Sweden. However, as ferry operations are having such a large scale, it is evident that government subsidies are not enough to cover all losses incurred. Therefore, this research aims to answer the following research question: How did the coronavirus pandemic affect ropax companies and Finland’s seaports? This research aims to examine how robust ropax operations are in the pandemic environment and provide perspectives for earlier research in the field as they, e.g., saw risks from a minimal angle, and the importance of passenger flows has not been adequately understood.
4. Overall Situation and Development of Ropax Operations
The long-term popularity of ropax ferries to/from Finland within passenger transportation is apparent as examining Figure 3. During five decades (1970–2019), passenger transportation volumes increased 539.4%. In 2018, the Helsinki seaport was the busiest passenger transportation seaport in the whole EU area, as Tallinn (Estonia) reached third place and Stockholm (Sweden) seventh (European Commission, 2020). In the first two decades, the volume growth of Finland was mostly driven by Swedish connections. Many people from Finland were engaged in the job market of the western neighbour (Sweden was instead receiving rather diverse immigration from different European countries early on; Rauhut, 2010). Also, trade was rampant, which resulted in a higher need for business travel. Together with these factors, tourism was a driver and the desire of people, groups and families, and this was often completed by taking sea cruises. As a result, passenger volumes were present from Finland and Sweden.

However, without the collapse of the Soviet empire and the regained independence of the Baltic States, notably Estonia, the volume growth of Figure 3 would not have continued for three more decades. In the late 1980s and early 1990’s, it was popular for Finnish people to visit Estonia for touristic reasons. After Estonian independence was regained in 1991, many manufacturing businesses moved to this new low-cost country. In addition, Estonians were eager to visit Finland and started to take part in the job market. As shown in Figure 3, the growth of 1990’s was much steeper than before – as from 1970 to 1989, passenger transportation volumes grew by 7.2 mill. passengers, from 1989 to 1999 they grew by nearly 6 mill. passengers higher. So, the growth rate measured against time nearly doubled. After this steep increase, growth matured for nearly a decade but started again after 2008–2009. After that, growth was much more moderate but still present. The reasons were the same as before, but now people and businesses started to understand that you could conveniently make same-day or one-to-two-day visits. This increased, e.g., short-term job market and tourism visits a lot (worker travel intensity is one of the highest between Estonia and Finland, especially among Estonians participating in the Finnish job market; Anniste et al., 2017).
It could be said that everything changed in ropax passenger transportation in Finland due Covid-19 pandemic. The first two months of 2020 were developing like 2019, but in March 2020, a steep volume decline suddenly stepped in. This was further accelerated by the governmental decision to allow only necessary travel, nothing else. For summer 2020, regulations were relaxed, and people returned to ferries. However, in the autumn time, infections accelerated again higher, travel volume started its dive, and regulations only increased further (only necessary travel again allowed). During the winter of 2020–2021, regulation changed again, and people travelling were much smaller occupation groups than before. For summer 2021, regulations were relaxed, but for borders started to appear Covid-19 test requirements (actually two tests, if you entered Finland, before border-crossing or at border-crossing point, and some days after arrival), however, easing requirements for fully vaccinated persons. The result of these policies and political changes was that passenger transportation amounts declined in 2020 by 65% from the previous year, and in 2021 volumes continued to decline further (–7.14% as an annual change). There is no comparison point in Figure 3 to this sort of two-year decline – the highest proportional decline is from 1974 (–9.9%), followed by a decline in 1994 (–7.1%). To illustrate the profound change of Covid-19, was regression model from overall passenger volumes built. There were two explaining factors for passenger volume of Finland – time (year) and Covid-19 (in years 2020 and 2021 having a value of one, and otherwise zero). A regression model was able to forecast 95.6% of annual passenger volume (Appendix 1), where both effects of time and Covid-19 were statistically significant (below 0.001 level). Annually, starting from 1970, passenger volumes have grown by 0.35 mill. passengers per year. However, Covid-19 had a destructive effect, where 14.9 mill. passengers were lost in both years 2020 and 2021. The effect of Covid-19 is 42.4 times higher than the annual growth of passengers – this gives perspective for forthcoming years in passenger transportation. Without the sudden end of the pandemic and/or removing all travel restrictions, it is very difficult (or nearly impossible) to reach back to pre-pandemic levels in passenger volumes.
Table 1 illustrates three different scenarios of waning Covid-19 effects (using coefficients of regression model) – in the most optimistic scenario passenger volumes would be back to 2019 levels in 2024, but in pessimistic situation it could take until 2028. All of these scenarios assume that Covid-19 effects will gradually diminish and in 2022 and onwards no full effect year will not any longer come.
Pessimistic: 90% Covid-19 effect in 2022, and declining by 10% points every year, being 10% Covid-19 effect in 2030; normal: 80% Covid-19 effect in 2022, and declining 25% points in three following years, and thereafter being 0%; optimistic: 70% Covid-19 effect in 2022, and declining 30% percentage points in 2023, and 20% in 2024, and thereafter being 0%). Shaded gray area in table for years, when pre-pandemic passenger volume is reached.
In absolute travel number terms, volumes of 2020 and 2021 were at the level of 1980–1981. Swedish ropax connections experienced a higher decline in 2020 as passenger volume declined by 72.9%, while in Estonian routes, the decline was 53.8%. In 2021, Swedish connections experienced some recovery as they grew from 2020 by 23.74%, whereas the Estonian route lost 22.3%. If the year 2021 volume is compared in Swedish and Estonian routes, it could be said that roughly two-thirds of passengers have been lost due to the pandemic era. In relative terms hardest hit was the Helsinki-Stockholm route – in 2020, Helsinki seaport passenger transportation volumes with Sweden declined by 83.5%. This was a partially business-based decision of two ferry companies to cancel this connection. The situation and passenger volume on this route were the same in 2021, showing only modest 7.84% growth from 2020. Route to Sweden from Helsinki is much longer than, e.g., Turku or Naantali, and there must have been business rationality behind this. The lowest decline in passenger amounts in 2020 was experienced in Naantali (–24.9%), and it also recovered in 2021 (+15.3% from the previous year). However, it should be stressed that this connection to Sweden could be mostly classified as roro ship and serving that of freight (trucks and drivers).
In ropax ships, another critical stream of revenue is unitized freight (i.e., semi-trailer trucks onboard). This is an important customer group as trade and logistics flows to nearby countries are often the most intensive. In the situation of Finland, this is the case too. As Figure 4 illustrates, freight volumes have been with Sweden from four to seven million tons from 1997 to 2021. However, as Swedish trade is more mature, it is hardly growing. For example, the total trade of Sweden and Finland in euros was nearly the same in 2020 as it was in 2008. However, global economic recovery in 2021 resulted in total trade growth of 20.3% from 2008. Particularly problematic has been Finnish exports, which are still at the level of 2005; understandably, freight flows will then show no growth. In addition, Sweden no longer offers the best hinterland opportunity for transit to other European countries due to environmental restrictions and payments (road use charges and higher cost fuel). In Europe, manufacturing activity has increasingly shifted to the east. As a result, unitized freight volumes declined from the previous year in 2019 (–2.6%) and 2020 (–2.9%). However, the year 2021 witnessed abnormal growth of 9.8% from 2020. It should be emphasized that freight volumes were in coronavirus years 2020–2021 at the same level (2020 a little bit lower and 2021 slightly higher) as they were in the first year of the observation period, 1997. As there is no long-term trend in Swedish freight traffic, it is understandable that the regression model using the time (years) and Covid-19 era as regressors did not gain any statistical significance (Appendix 2).
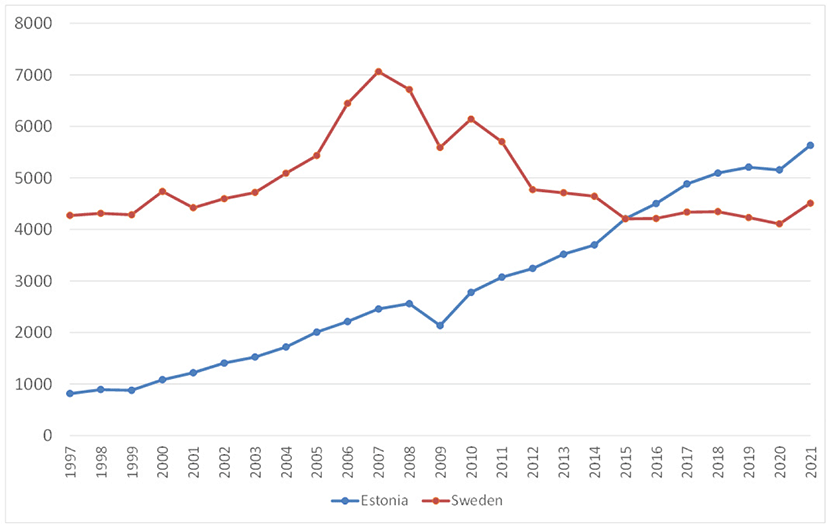
However, the Estonian route is opposed to this, where freight volumes have constantly been growing only with minor annual corrections (1999: –1.6% and 2009: –16.6%). The year 2020 of the corona crisis also led to a slight decline compared to 2019 (2020: –1.0%). However, this was rapidly recovered in 2021 by annual growth of 9.2% (repeating exactly the same pattern with earlier corrections, which were recovered shortly in the following year). Although Estonia is a much smaller country in population and economic terms than Sweden (e.g., Hilmola, 2019), it is now bigger in short-sea shipping unitized freight with Finland. There are reasons for this (numerous factors contributing to long-term growth: Hilmola, 2014). One of them is the opportunity for manufacturing, trade, and other businesses (like the service industry, laundry services etc.) to use Estonia or the other Baltic States as a part of their supply chains to have much lower costs and still have a good level of quality and service. Also, the hinterland position of Estonia is beneficial as one may reach large Central European markets (Poland, Czech Republic, Slovakia, and Germany) by truck or train, in addition to emerging eastern markets (Belarus and Ukraine). The sea journey between Estonia and Finland is relatively short (approx. 80 km), and it takes typically 2–3 hours for ropax ships to sail the route in one direction. This has been an important competitive advantage in recent decades as sea transportation has become higher priced due to more demanding environmental standards (such as sulphur regulation, resulting in higher fuel costs; Hilmola, 2019). In the regression model, where volume development was explained with time (year) and the Covid-19 era, it was found that time was statistically significant (below 0.001 level) and was alone explaining the volume progress with a high precision rate (R2 is 97.4%). As Appendix 3 shows, unitized freight volume increases by 206.1 thousand tons every year (time-based co-efficient has slightly increased as in Hilmola's (2014) research it was 175.2 thousand tons per annum). Covid-19 effects were not statistically significant in the model.
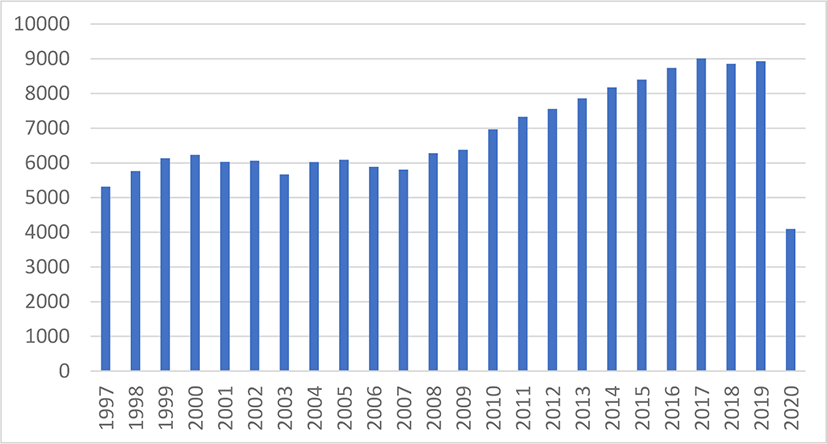
During pandemic times, the financial performance of three ropax companies serving the Finnish market was dramatically worsened. In 2020, revenues declined to roughly half of 2019 (–55.4%; Figure 5). Recovery in 2021 was somewhat limited, where revenues improved by 14.2% compared to 2020. The regression model was built to reveal reasons for revenue change. Time (year) is statistically significant and positive in the model (annually revenues increase 52.2 mill. EUR), whereas Covid-19 period (binary, being one in 2020–2021, while in other years zero) in turn was big negative impact event with even higher statistical significance (Appendix 4). Based on the model, Covid-19 reduced revenue annually 1.178 bill. EUR. These two regressors explain 72.4% of revenue development over the years. Again the Covid-19 effect is massive compared to time-based annual increases – being 22.6 times higher in magnitude. Getting rid of Covid-19 effects is a key to reaching pre-pandemic revenue levels.
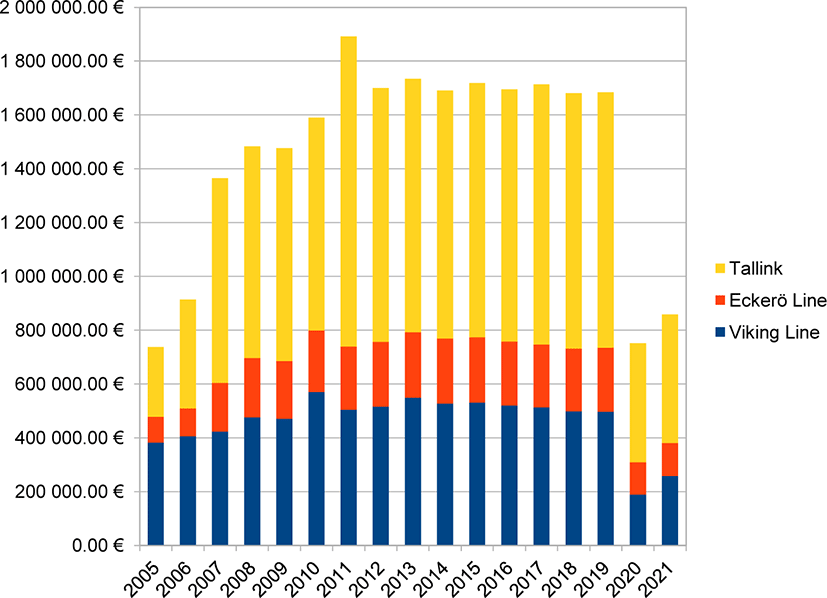
Local governments in Finland, Estonia, and Sweden provided support packages for these companies. However, packages were just to provide the ability to carry operations on, and this in operative cash-flow terms. Shipping is an asset-specific business, and annual depreciation of assets (shipping fleet) has a significant fixed impact on total costs and continuous maintenance of these assets. Therefore, were deficits rather significant in 2020. In total, these three companies made 184.4 mill. EUR of loss in 2020, which could be compared to 2019, when profits were 61.3 mill. EUR (2019 was a somewhat “typical” year in profit terms). As all three ropax companies are reporting publicly their financial performance (all have a public shareholder base), the big picture in 2021 has not changed significantly better as total losses amounted 62.8 mill. EUR.
Regarding financial deficits, the situation has varied among the three companies. The largest operator, Tallink, which operates extensively with three ropax and one roro ship(s) at the Helsinki-Tallinn route and having two ropax ships on the Turku-Stockholm route as well as two ropax ships on the Helsinki-Stockholm route. In addition, other ropax routes have been available and operating, like Tallinn-Stockholm and Riga-Stockholm. Tallink has reported that its losses were approx. half in 2021 as compared to 2020. In Eckerö Line, which operates one ropax and roro ship on Helsinki-Tallinn route, and some freight and passenger transportation from Åland to Finland and Sweden and other countries), deficits are at a similar level in 2021 as what they were in 2020 (with slight improvement). Viking Line, operates one ropax ship throughout the year at Helsinki-Tallinn route, and two in Turku-Stockholm as well as one in Helsinki-Stockholm route, also other shipping services between Finland and Sweden, is the only ropax operator showing profits in 2021 – this was primarily due to assets sales in accounting year with profits (as compared to balance sheet value; sold ropax vessel and passenger terminal). However, all three companies have continued to receive governmental subsidiaries (due to pandemic) in 2021, and losses are higher than the overall sum of 62.8 mill. EUR.
It is important to analyze further why revenues and profits declined so significantly in 2020 (and recovery has been weak in 2021). The largest actor of ropax companies, called Tallink, has the most developed reporting structure among these three companies (e.g., Tallink, 2019). In 2019, they showed that 56.5% of revenue was gained from product and restaurant sales (both provided in ships and within some hinterland locations). The second-largest revenue stream was ticket sales (passenger), which had a share of 25.4%. In addition to maritime services, Tallink also owns some hotels, and their revenue share in 2019 was 1.7%. If all these three are summed together, it could be concluded that 83.6% of revenues were significantly dependent on passenger transportation, services and tourism. Therefore, it is understandable that freight transportation of ships cannot cover or save these companies alone – freight rates would need to increase with very high multiples that this would be a reality. Without removing restrictions on travel and gaining the willingness of people to use these services as before, shipping companies have difficult times ahead, and restructuring operations is the most probable route to proceed further. So, the lowest profitability routes are evaluated, possibly resulting in vessel sales (as the second-hand market is so lucrative due to globally high inflation and lower restrictions in other countries). However, it should be highlighted that not all shipping firms are in trouble – those concentrating on freight have done rather well in the crisis year 2020 and exceptionally well in 2021. For example, a well-known roro shipping company, called Finnlines was showing decent profits even in 2020, and it primarily serves Finland and Northern Europe (Finnlines, 2021).
5. Freight Flow Changes
Earlier it was concluded that unitized freight volumes between Finland and Estonia and Finland and Sweden were declining during the corona crisis year 2020. This is an aggregate situation, but development varied between different seaports a lot. It should be reminded that unitized cargo in this analysis is primarily trucks with a semi-trailer. In some situations, there is only a semi-trailer (that is rolled on and off with tractors). Semi-trailers could also be carrying containers. However, unitized cargo seldom consists of solely containers (without trucks), so most cargo is transferred on routes with ropax or roro ships.
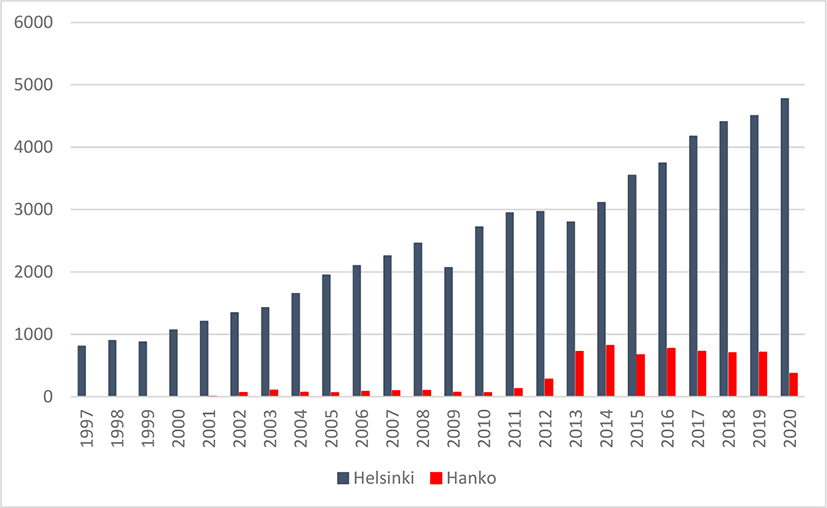
At the aggregate level, it was said that Estonian unitized cargo declined a little bit in 2020. In Finland, Estonian unitized cargo has been completed by two seaports, namely Helsinki and Hanko (both in the south and not that far away). All Estonian year-round operating ropax ships call Helsinki (in summer months, there have been some very marginal connections to other ports). It offers numerous departures per day with high frequency to the old city of Tallinn. Two other ships in the Helsinki-Tallinn route are merely roro ships, and they both use Tallinn’s cargo port, Muuga. Hanko has been serving only roro ships, and this is in route of Hanko-Paldiski (westernmost location of Estonia). The year 2020 changed the situation between Helsinki and Hanko so that Helsinki grew in freight volumes as Hanko declined (Figure 6). It was actually so that the Estonian connection of Hanko was cancelled in the final months of 2020 as there was not enough cargo (freight operator shifted roro ship to another route, serving Estonia-Sweden).
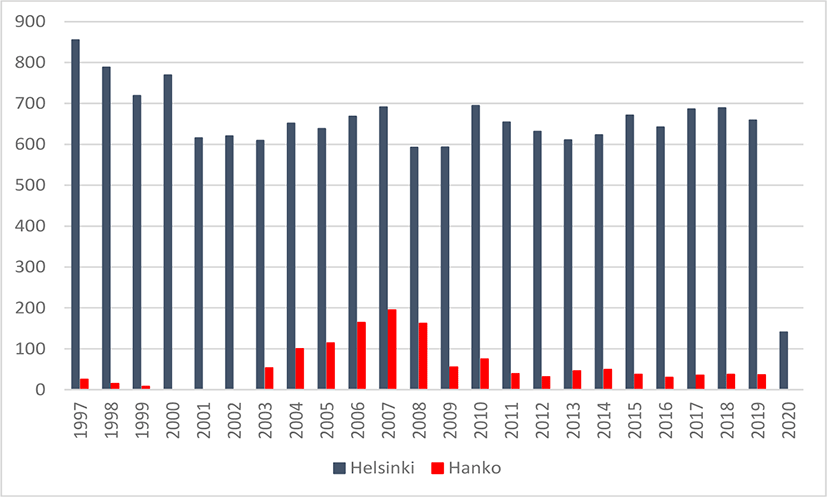
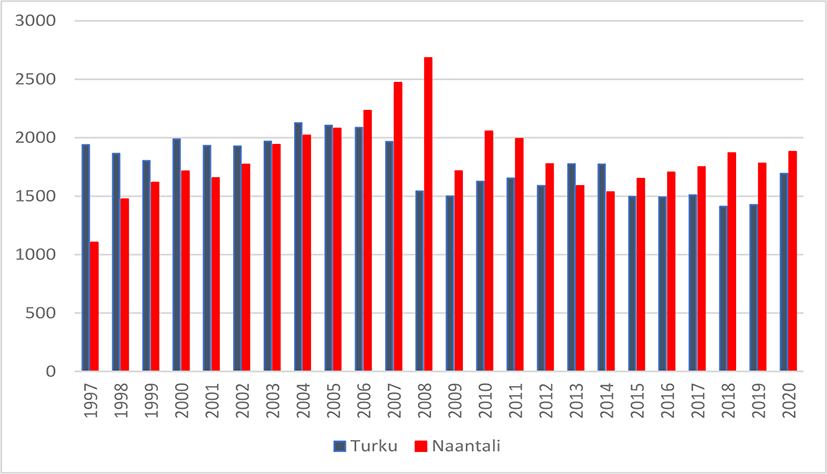
Swedish unitized freight situation of seaports was more diverse before the coronavirus crisis. Freight flows were shared among three seaports, namely Helsinki, Turku, and Naantali. In addition, some roro ships operated from Hanko and one ropax ship from Vaasa to Sweden. However, in 2020 rather drastic changes took place. First, freight volumes to and from Hanko ceased to exist. With this, ropax connections (in total, four ships and two different companies) from Helsinki to Stockholm were taken off due to governmental restrictions and the lack of travel demand. However, it was a business-based decision in the end. Figure 7 illustrates the situation further – the decline in Helsinki freight volume was 78.7%. However, the situation in the Swedish direction is similar to Estonia – the largest ones benefitted from the crisis and absorbed the volumes. Two westernmost seaports, Turku and Naantali, were growing in 2020, as Figure 8 shows. Turku benefitted most in both relative and absolute terms. It should be highlighted that from Naantali, there are no ropax connections to Sweden, but it is served by two roro ships (two).
In 2021, the situation did not change that much. Hanko is still without a unitized regular cargo connection to Estonia, and ropax ships operating between Helsinki and Stockholm were for a long time out of route (ships were brought back to route in July/August of 2021). In addition, one ship (out of four) from the Helsinki-Stockholm route was sold abroad. So, the situation remains more or less the same as in 2020, where the most prominent volume routes grew in dominance over smaller ones.
6. Passenger Flow Changes
Earlier sections concluded on an aggregate level and within seaports on how passenger transportation developed in 2020. Loss of volume was substantial (65% decline in passenger handling of entire Finland). However, an additional angle to passenger transportation volume development from a long-term perspective could be gained from other statistics, which only examine passenger volumes crossing country borders (Eurostat, 2021b). This statistical database is the only source having long-term data available from particular seaports and passenger flow directions. However, it should be highlighted here that many passengers in ropax ships are just taking cruises and do not necessarily enter other countries. This was a prevalent short-distance touristic form in the pre-pandemic era (for decades). Examining only passenger flows, crossing borders could provide long-term visibility as touristic flows for cruises will take longer to come back after the pandemic – it could be assumed that the need for travelling is more real for people crossing borders.
During the pandemic year 2020, passenger transportation border crossings dropped significantly. However, countries and seaports do differ. The best performing was Estonian direction (Figure 9), where ropax ferries out of Helsinki lost 53.7% from the volume of 2019. This volume is also the lowest in the entire observation period starting from 1997 (actually, the year 2020 is 22.8% lower than 1997). For Finnish Estonian connections, Helsinki is the sole seaport offering connectivity (there exist some minimal volumes from other seaports, but that has been for summer travel and developed packages).
For Swedish ropax connections, border-crossings have developed much less favourably (Figure 10). From Helsinki, passenger volumes declined 83.5% (partly could be explained by ropax operators’ shut down Helsinki-Stockholm connection during 2020). From Turku, the decline was lower but still substantial, 68.7%. There are other seaports of Finland (Naantali and Vaasa) offering also connectivity to Sweden, but passenger volumes are much lower. For example, in these statistics, Naantali was performing best as it lost only 24.4% in 2020 (as mentioned earlier, it is roro connection). From Vaasa, there is also ropax connection to Sweden, and it experienced in 2020 decline of 72.5%.
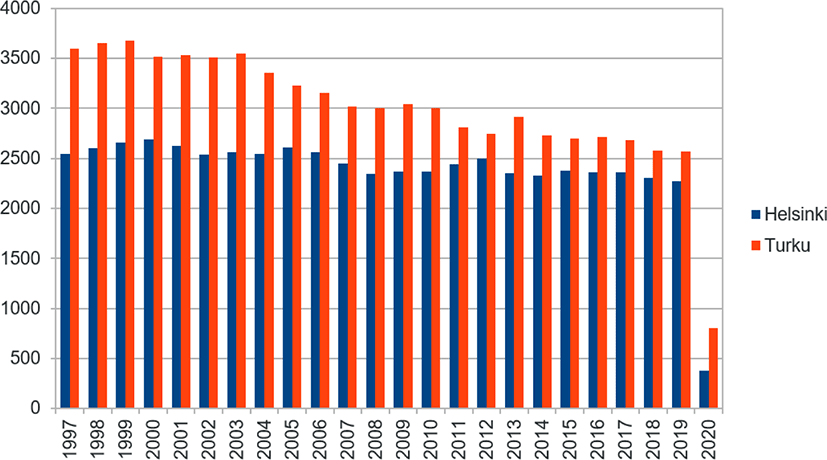
From a long-term perspective, if examining both Figures 9 and 10, it could be concluded that passenger transportation volumes were already experiencing levelled off or declining development before 2020. For example, Estonian connection could not show growth after 2017. In addition, Swedish ropax connections from Helsinki and Turku are clearly on a long-term declining path. Due to this reason, it is not easy to forecast future volumes. If coronavirus eases and diminishes from the earth, then Estonian ropax connections at best are in the volume levels of 2017–2019. This could take time as the psychological effect of the pandemic must be well placed in the memory of older people (who might be frightened to take travel services as before). In Swedish connections, passengers’ volumes will probably seek to catch declining trajectories in the long term. So, in the post-pandemic world, volumes are probably lower than in 2019.
7. Conclusion
For five decades, ropax ships serving Finland were enjoying the long-term growth of passenger transportation, and there seemed not to be any dangers on the horizon. There were some periods of moderate or levelled off demand, but passengers’ volumes never declined by more than 10% from the previous year. After these earlier declines, passenger volumes always recovered in the following year. However, the years 2020–2021 and the coronavirus pandemic showed a clear difference. In 2020, passenger volumes declined by 65% in all Finnish seaports. In 2021, the situation has remained on a declining path, which differs from previous years of challenging demand. The built regression model revealed that Covid-19 reduced passenger volumes by 14.9 mill. passengers per year. Another regression model further illustrated change as revenues were reduced annually by 1.178 bill. EUR. It could be said that ropax operators serving Finland are currently experiencing the hardest time in record, and for risk management of the future, pandemics need to be taken better into account, e.g., concerning investments and pricing (compared to pre-pandemic risk models, e.g., Endrina et al., 2018; Zeng et al., 2017).
The situation seems not to be just a contemporary softening of demand. However, it seems that this depression will last for a more extended period. This is in line with Christidis et al. (2021) simulation research, where pre-pandemic demand of EU-27 countries in airline travel will be reached in 2030, and for public transportation modes, like rail and bus, it will take even longer. Of course, it depends significantly on disease situation as well as political decisions (latter as the most important item of roro and ropax shipping growth within Arof (2018) study), how forthcoming years will develop at ropax shipping (based on studies spreading of Covid-19 as taking airline travel is very low). However, passenger volumes distribute the virus to destinations later-on (Sun et al., 2021). If the virus disappears in the summer of 2022, northern countries may get back to normal, and we may see some growth in 2022 (as Table 1 illustrated through three different scenarios). However, if politicians see that closest neighbours and borders are the worst places to spread the virus, it is questionable to see growth in 2022, and recovery will occur later, in 2023 or 2024. Anyway, three to five years of significant volume loss in passenger volumes will need time to recover. Therefore, the years 2024–2028 could be estimated with current knowledge (Table 1) as a period when passenger demand is at normal pre-coronavirus level (in some situations, pre-virus volume levels might not ever be reached, as concluded in earlier sections). If virus waves will be around for a more extended period (than 2022–2023), then it is understandable that use 2030 as the earliest typical demand year is justified.
What has been positive and sustaining during the Covid-19 crisis for ropax shipping companies has been the demand for the freight segment. Regression models did not find any relationship between freight volumes and Covid-19 era. The year 2020 was a challenging year in worldwide demand terms for unitized cargo. However, ropax operators serving Finland experienced rather good demand even then (having only a minor decline). Freight volumes have developed in a rather good manner in 2021. This is also reported in other regions in the earlier study by García et al. (2021). Also, prices globally for sea transportation have been under pressure, and huge increases in freight rates have been seen in containers (but other cargo segments have followed this). This provides an opportunity for ropax operators. If freight rates continue to increase, even in more local sea transportation, this offers a path to shrink losses and increase revenues. However, it is difficult for these companies to handle more freight as ropax ships are built to serve both trucks and private cars/lorries. If the latter ones do not have that much demand, it is not easy to load more trucks on higher decks. It is to be seen whether ropax operators will enlarge their presence in freight services as they did earlier with passenger transportation (offering services at ships, selling products, providing hotel services, and taxi transportation). For example, enlarging to trucking or warehousing could be one option. In the end, it should also be noted that ropax freight is already serving time-sensitive and time-based supply chains, and it is typically higher priced than containers (Zheng et al., 2021). Therefore, it is not that apparent that prices could increase promptly as starting ground is already higher. In addition, emission reduction schemes and possible payments in the forthcoming years decelerate the competitiveness of ropax vessels in the freight segment (Christodoulou et al., 2021).
As further research concerning ropax operations in Finland, it would be interesting to examine how to ship type shall change in the future. The earlier recipe for success was building glorious ships, which served passengers and consumptions well, and where freight was served alongside it. Currently, two of the three analyzed companies hold one roro ship each, serving the Estonian route. These have been relatively successful in the current environment and could be showing a path forward in the construction of future ships. So, it means fewer decks, fewer services, and more back to the basics. The change could be similar to what happened to airlines after the 1970’s and 1980’s – luxury was quite much removed, and if one desired to have it, later on, business ticket prices differed rather substantially from ordinary ones. This possible shift will also mean a change in routes, where time will be more critical than enjoyment, services and cruising.
